TAUBER Grafana Integration
for BMC TrueSight Operations Manager
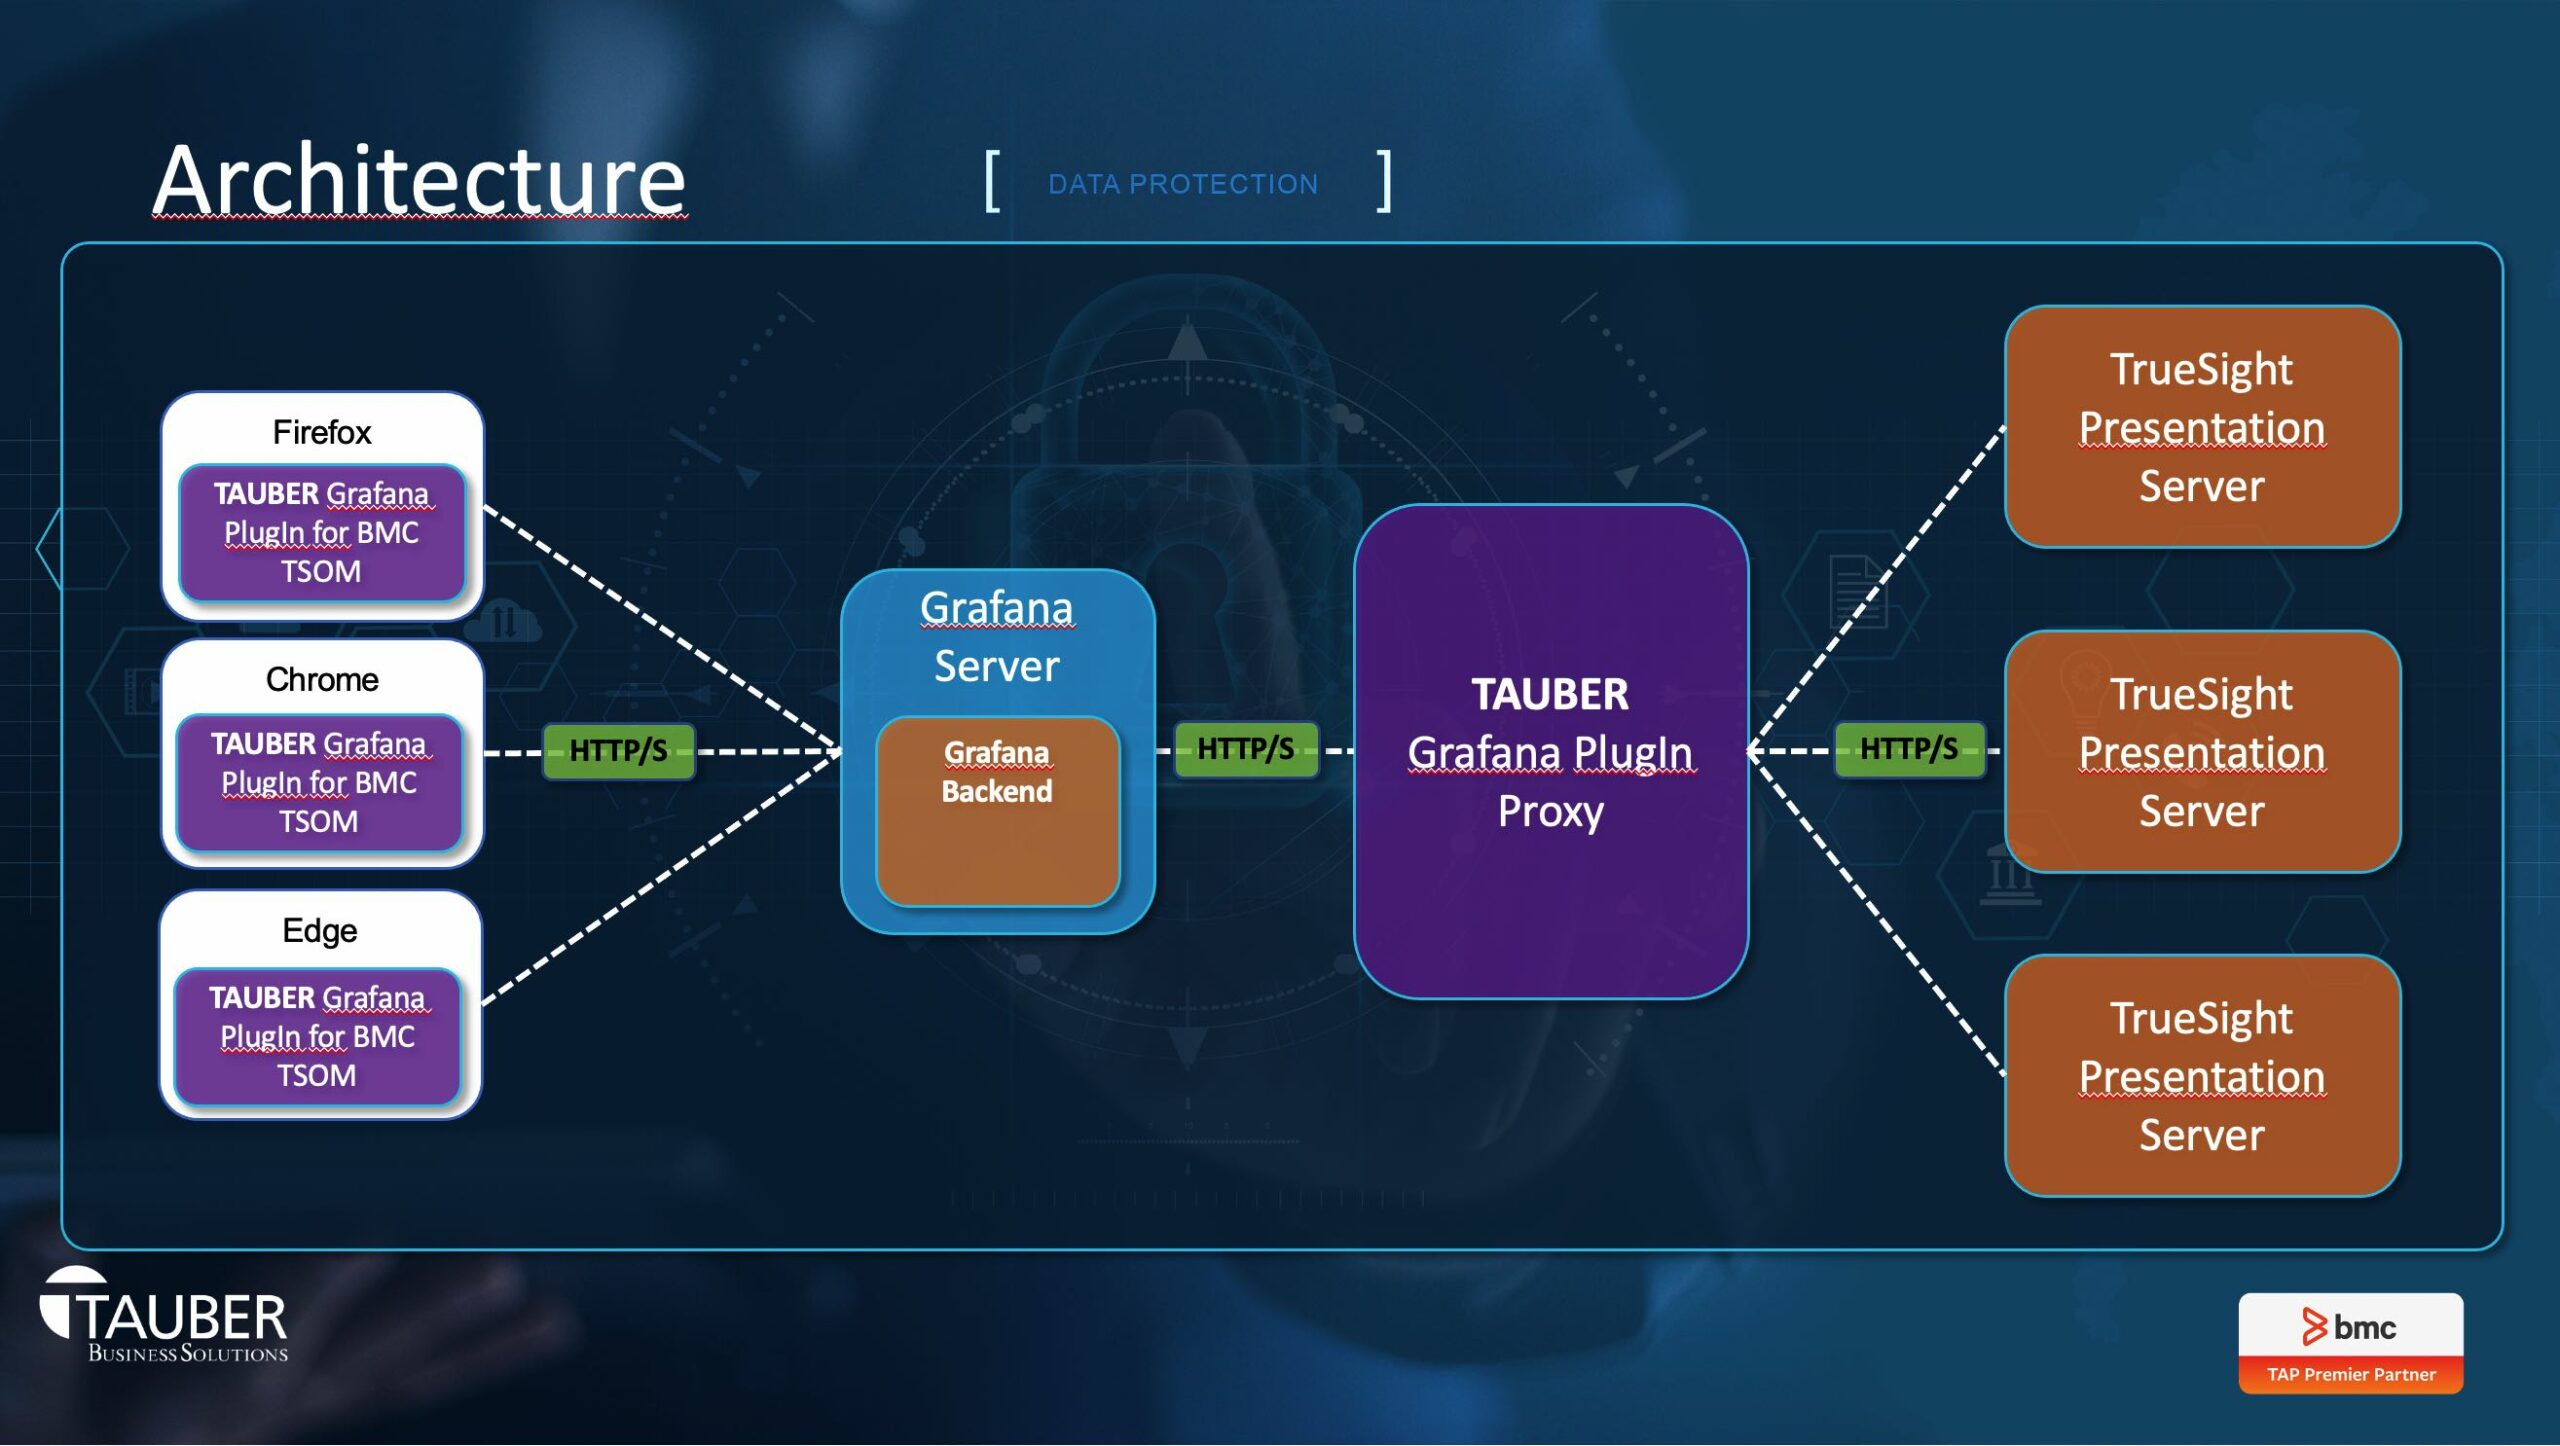
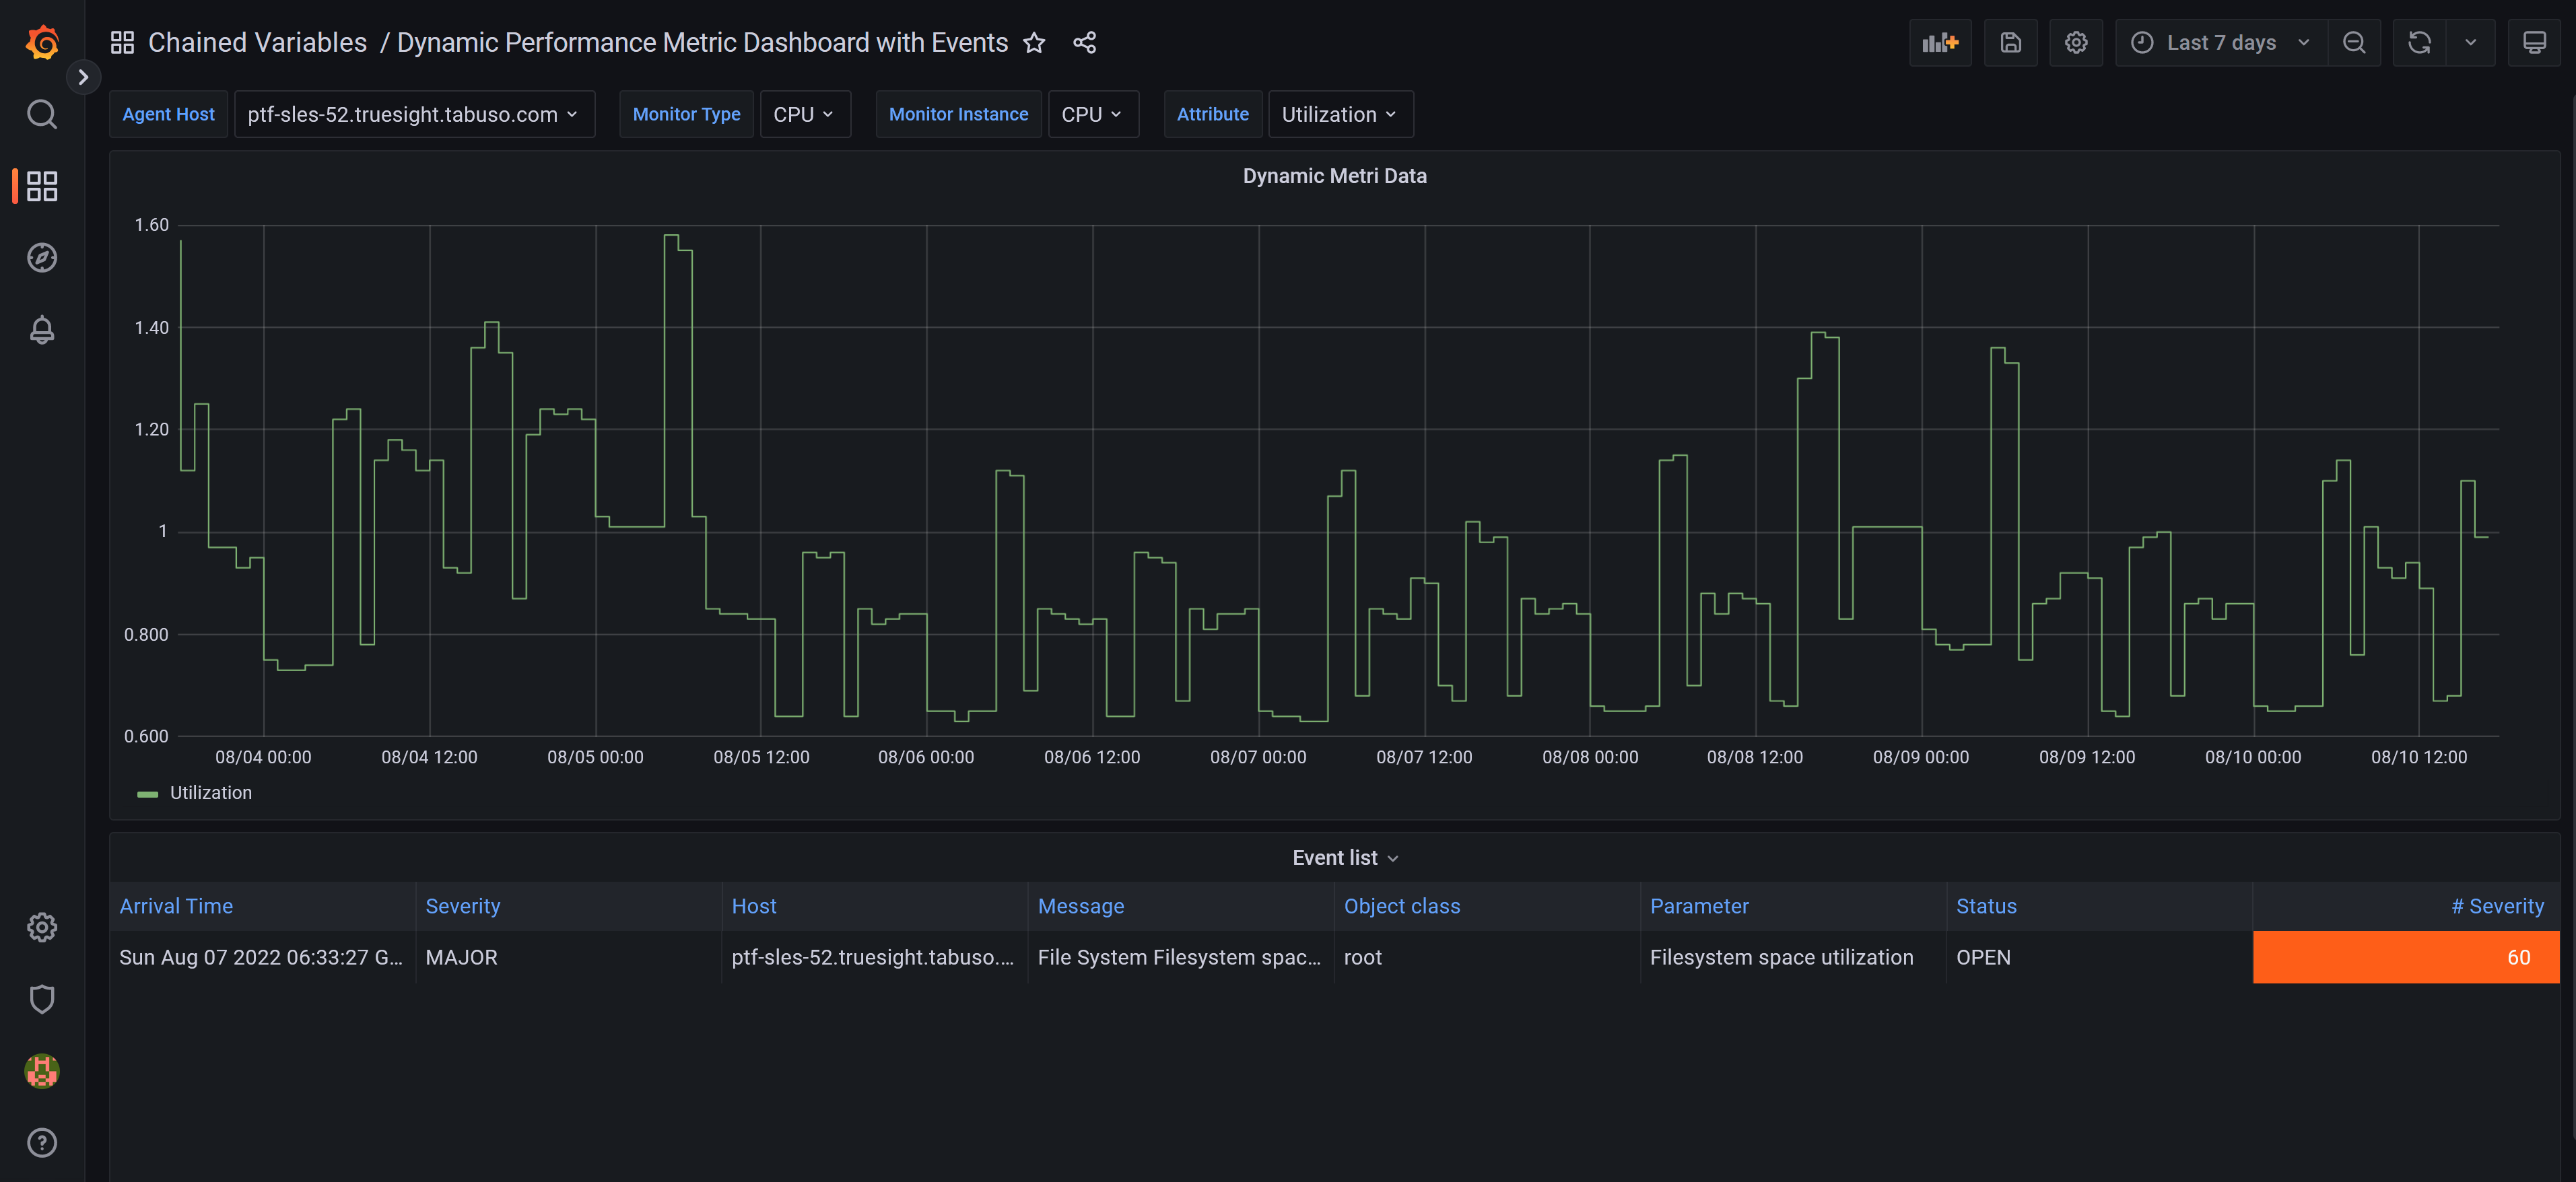
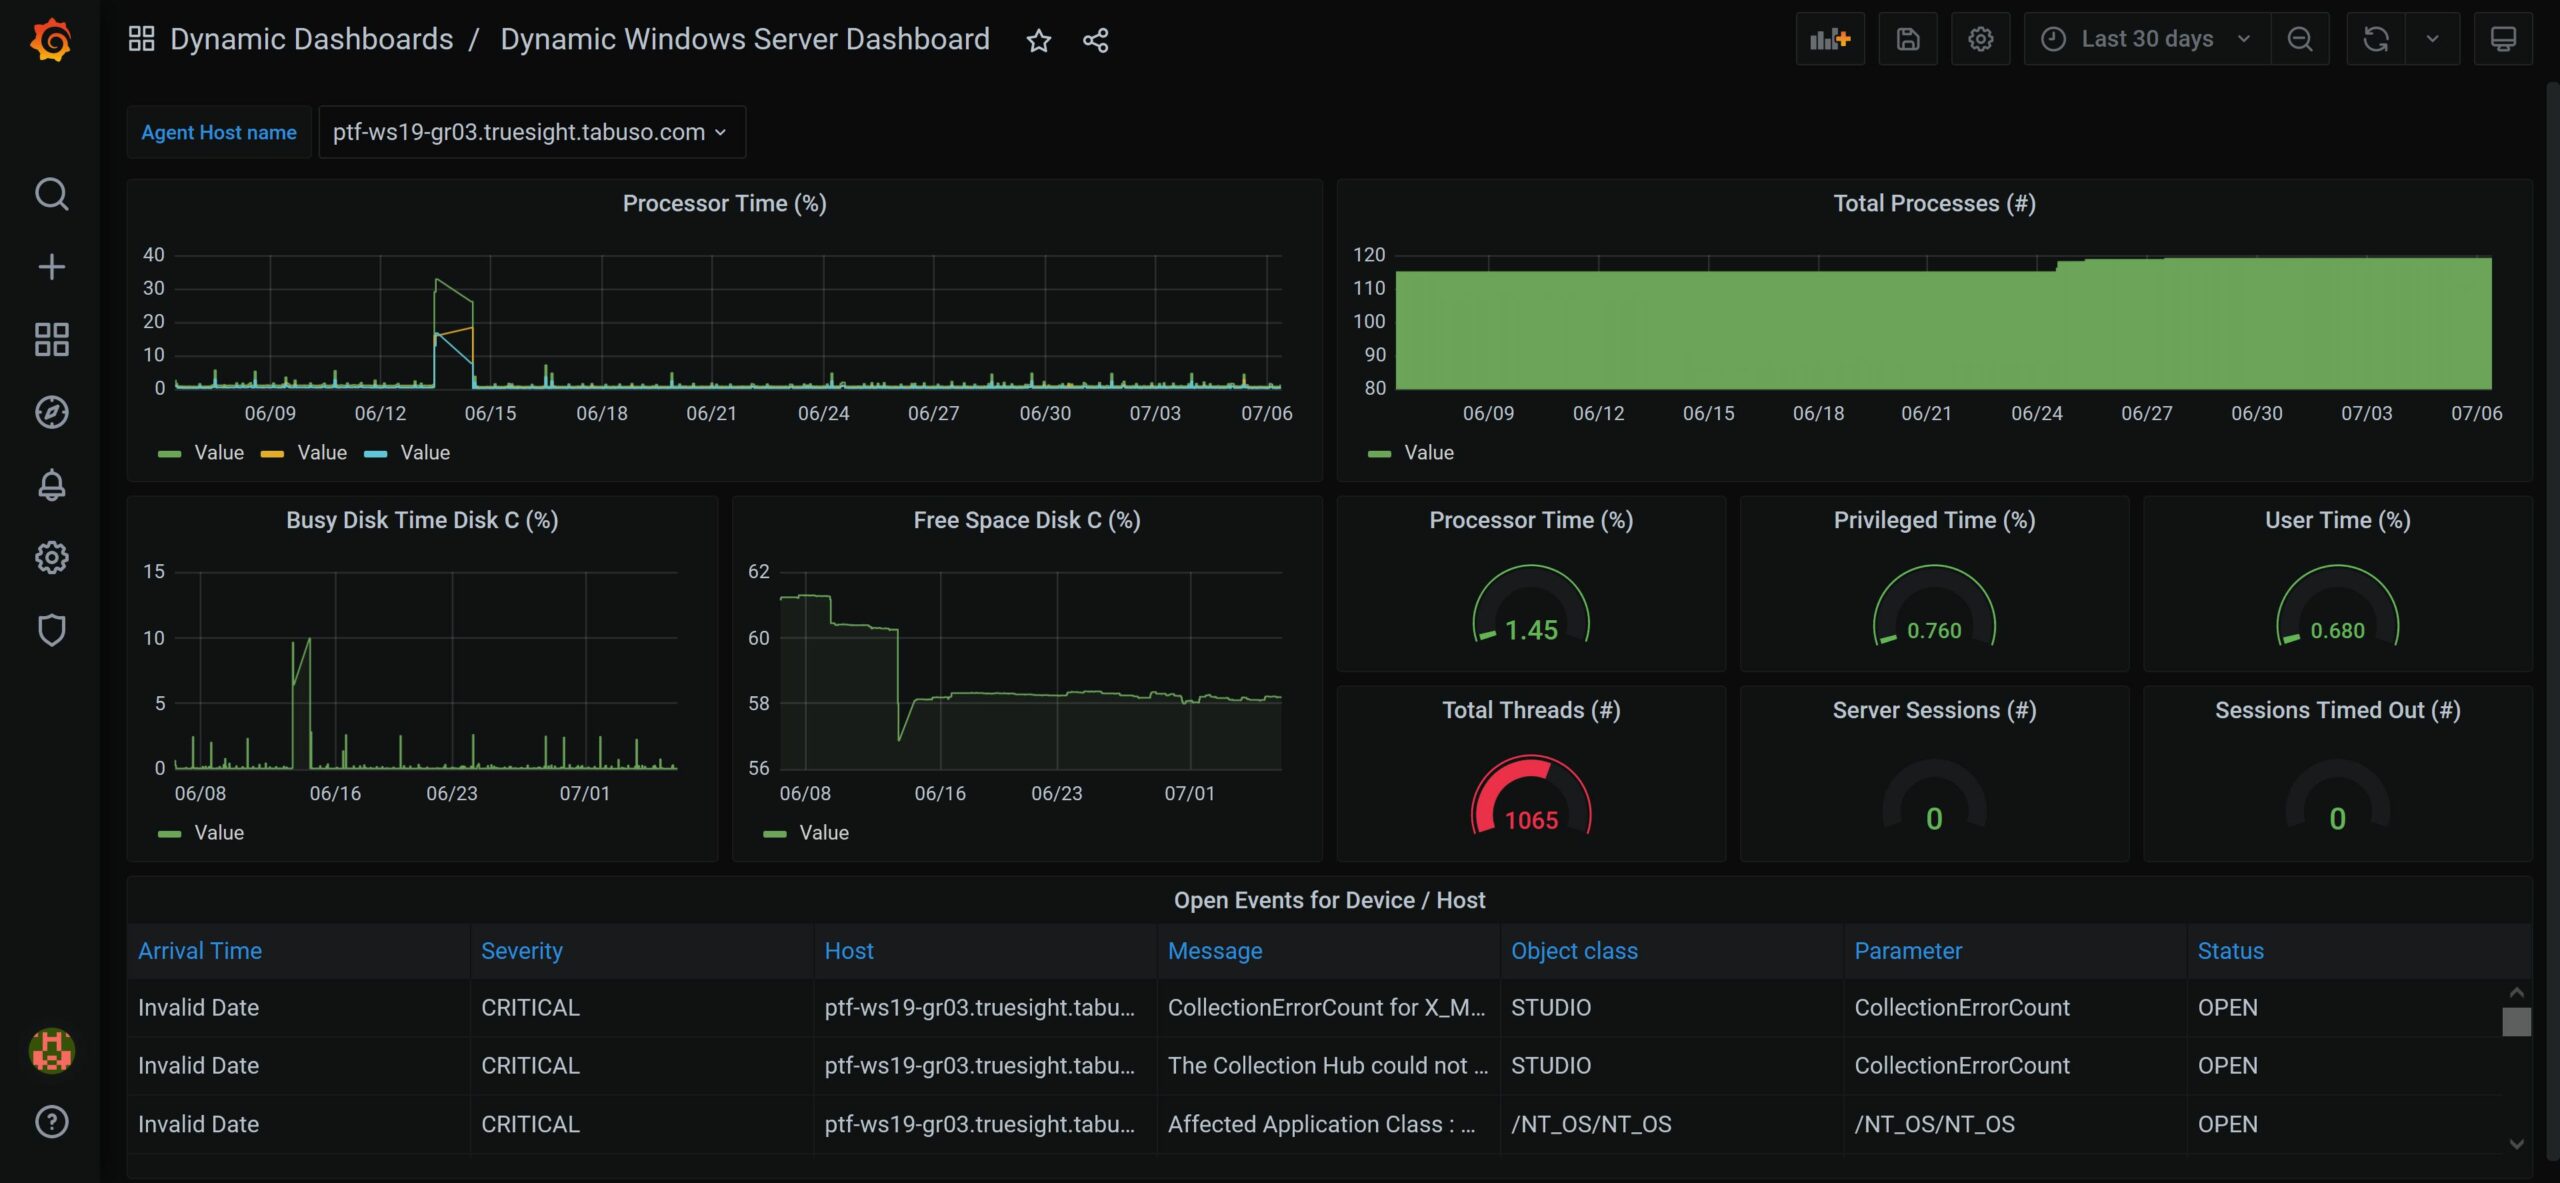
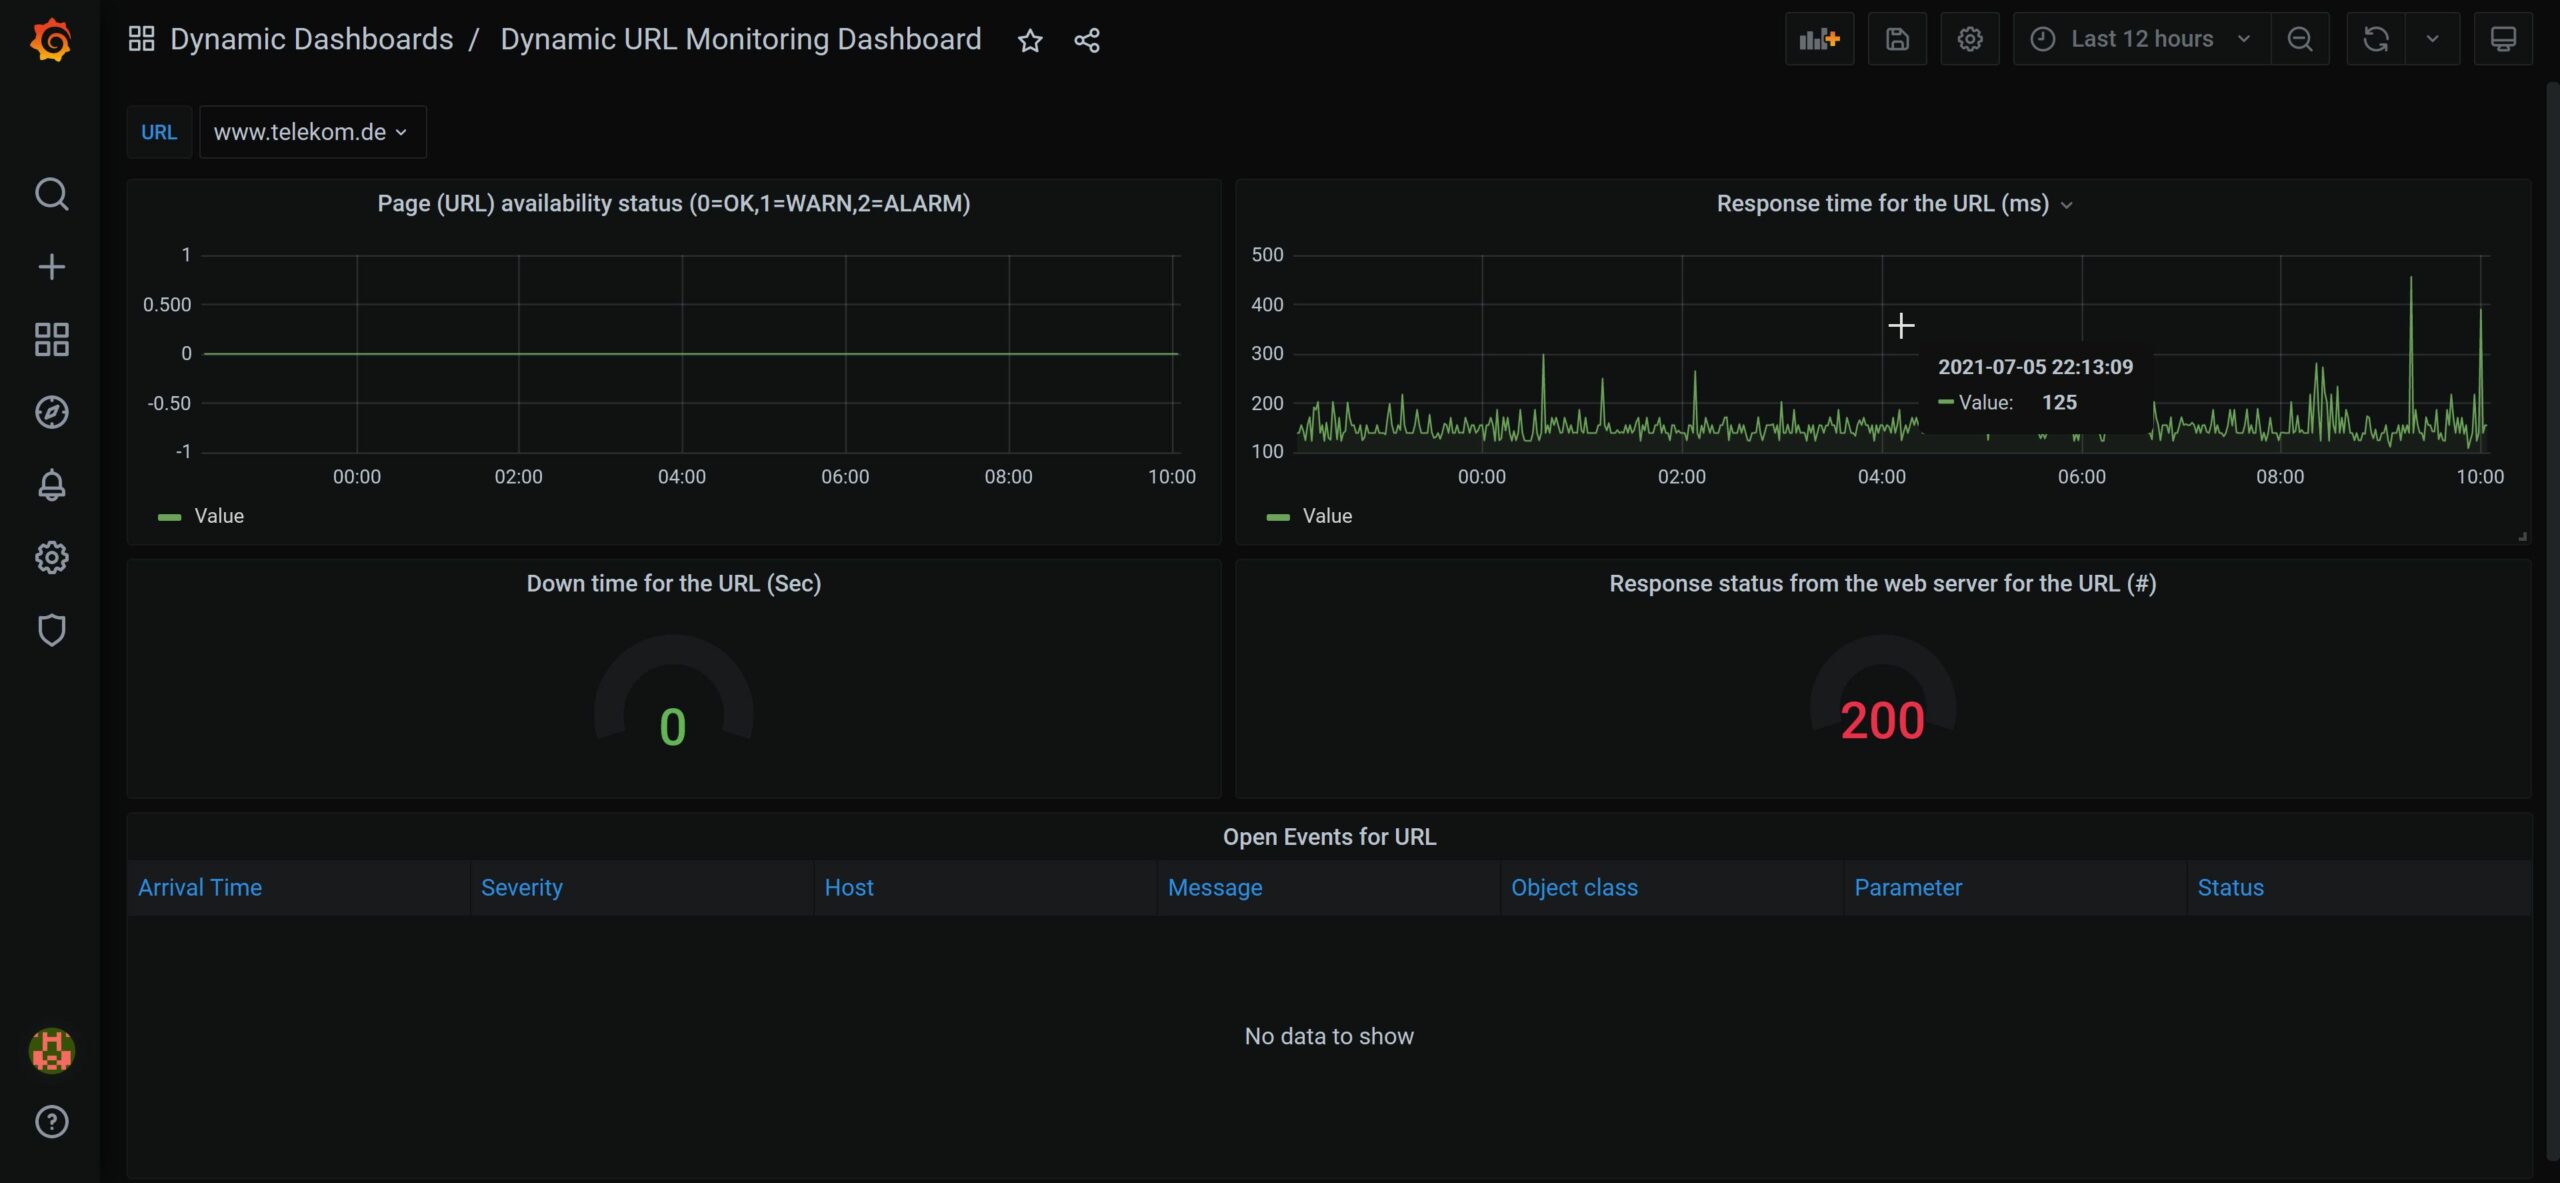
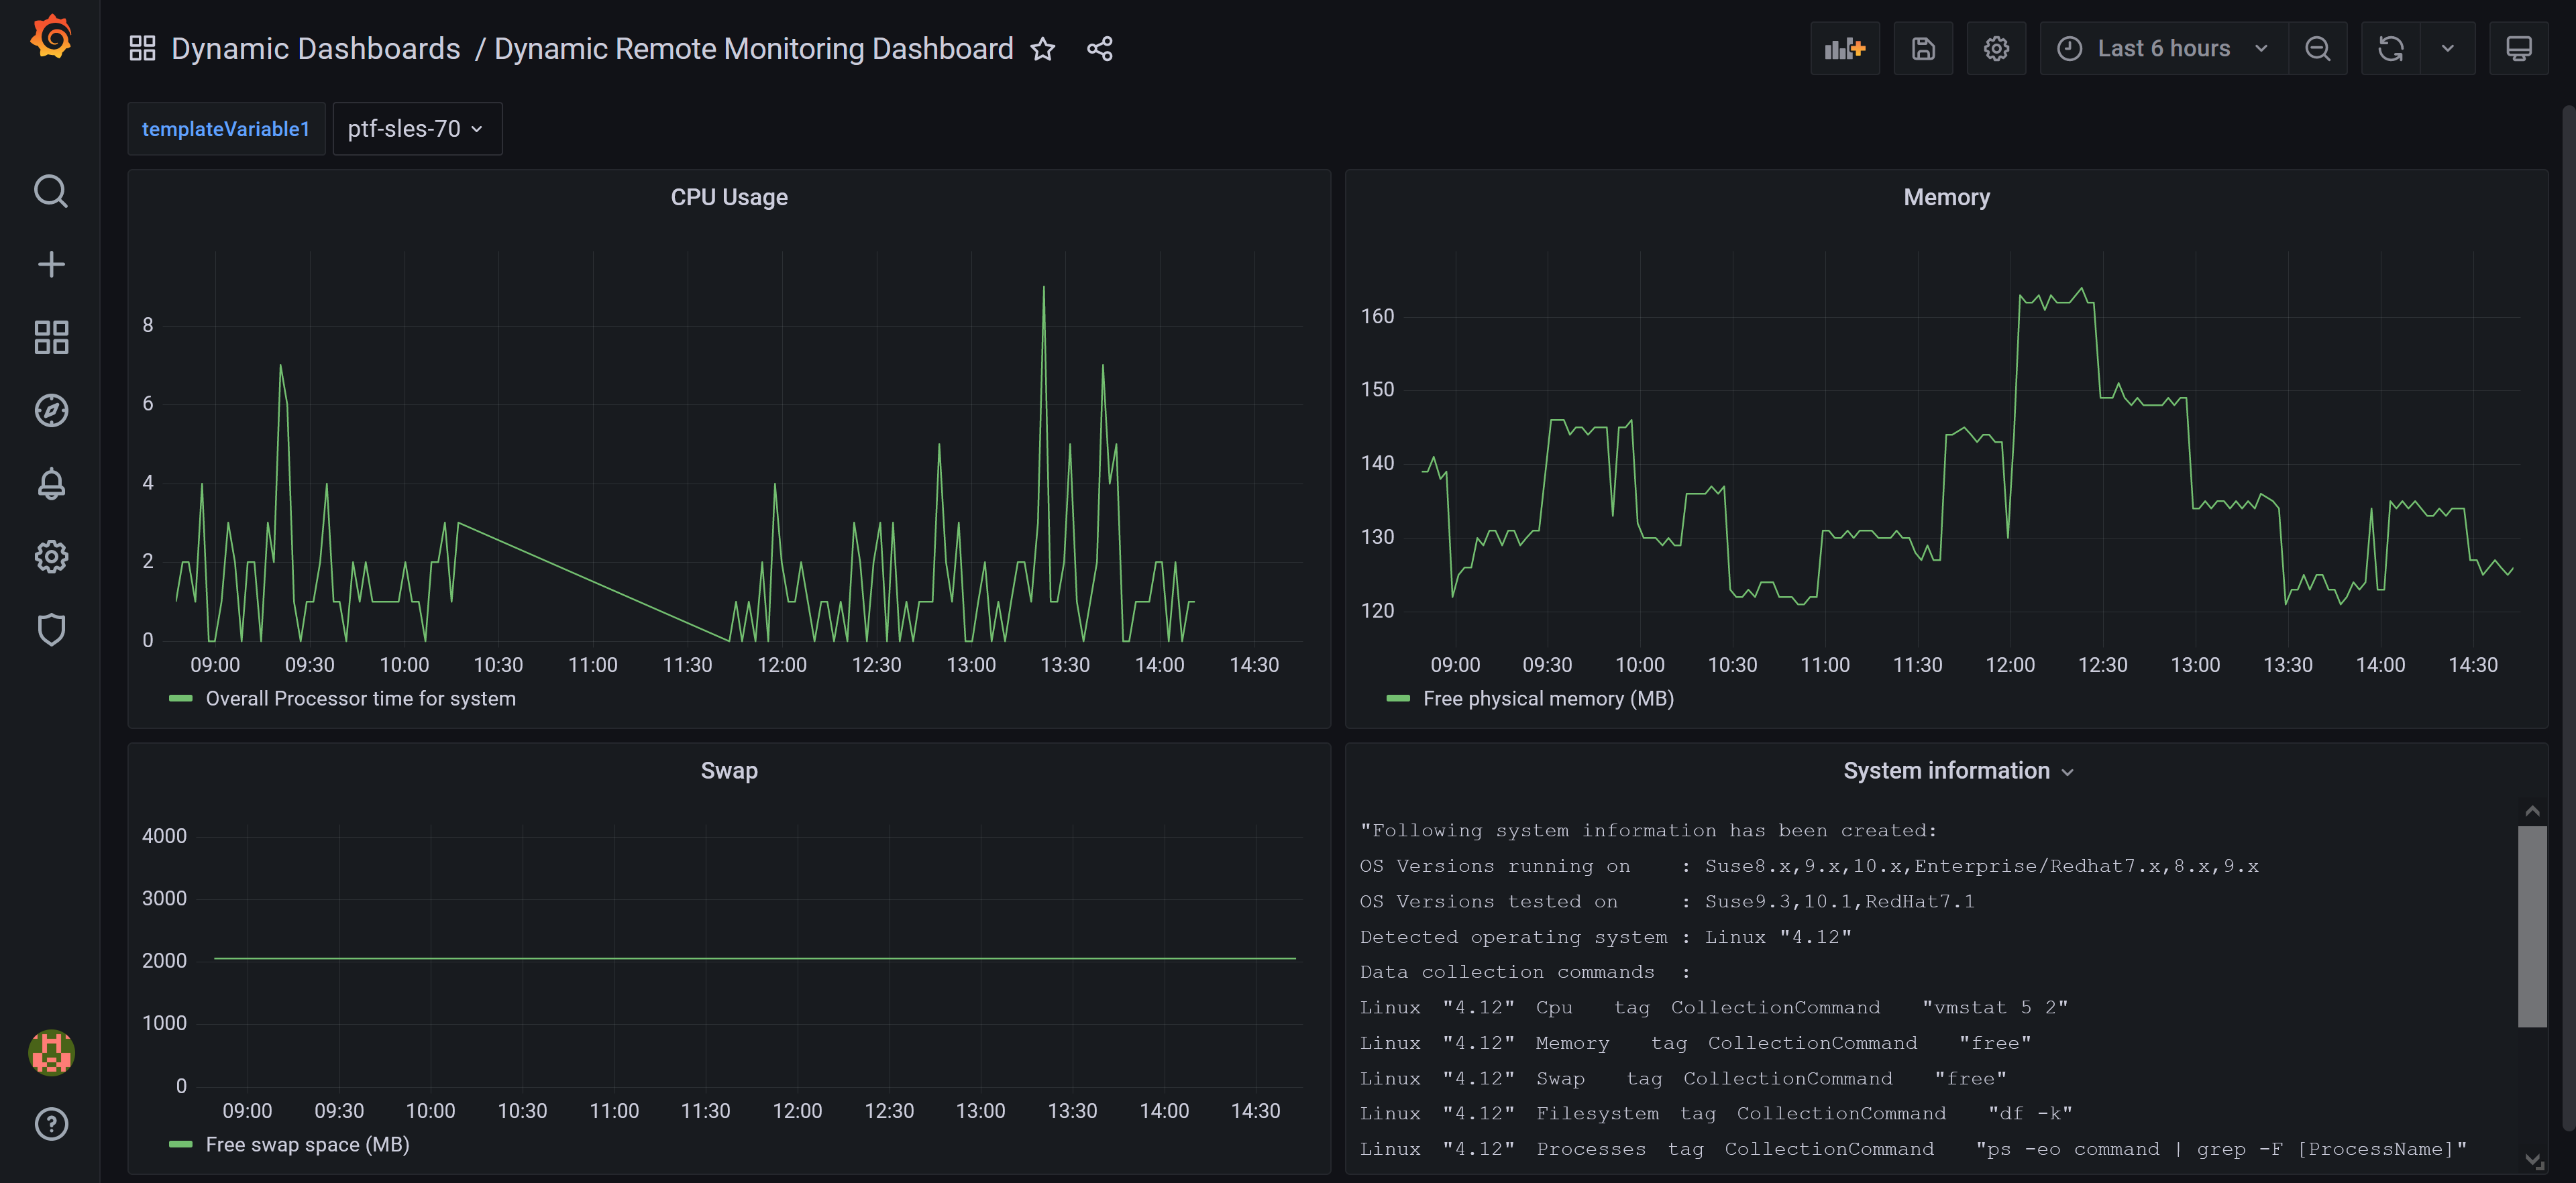
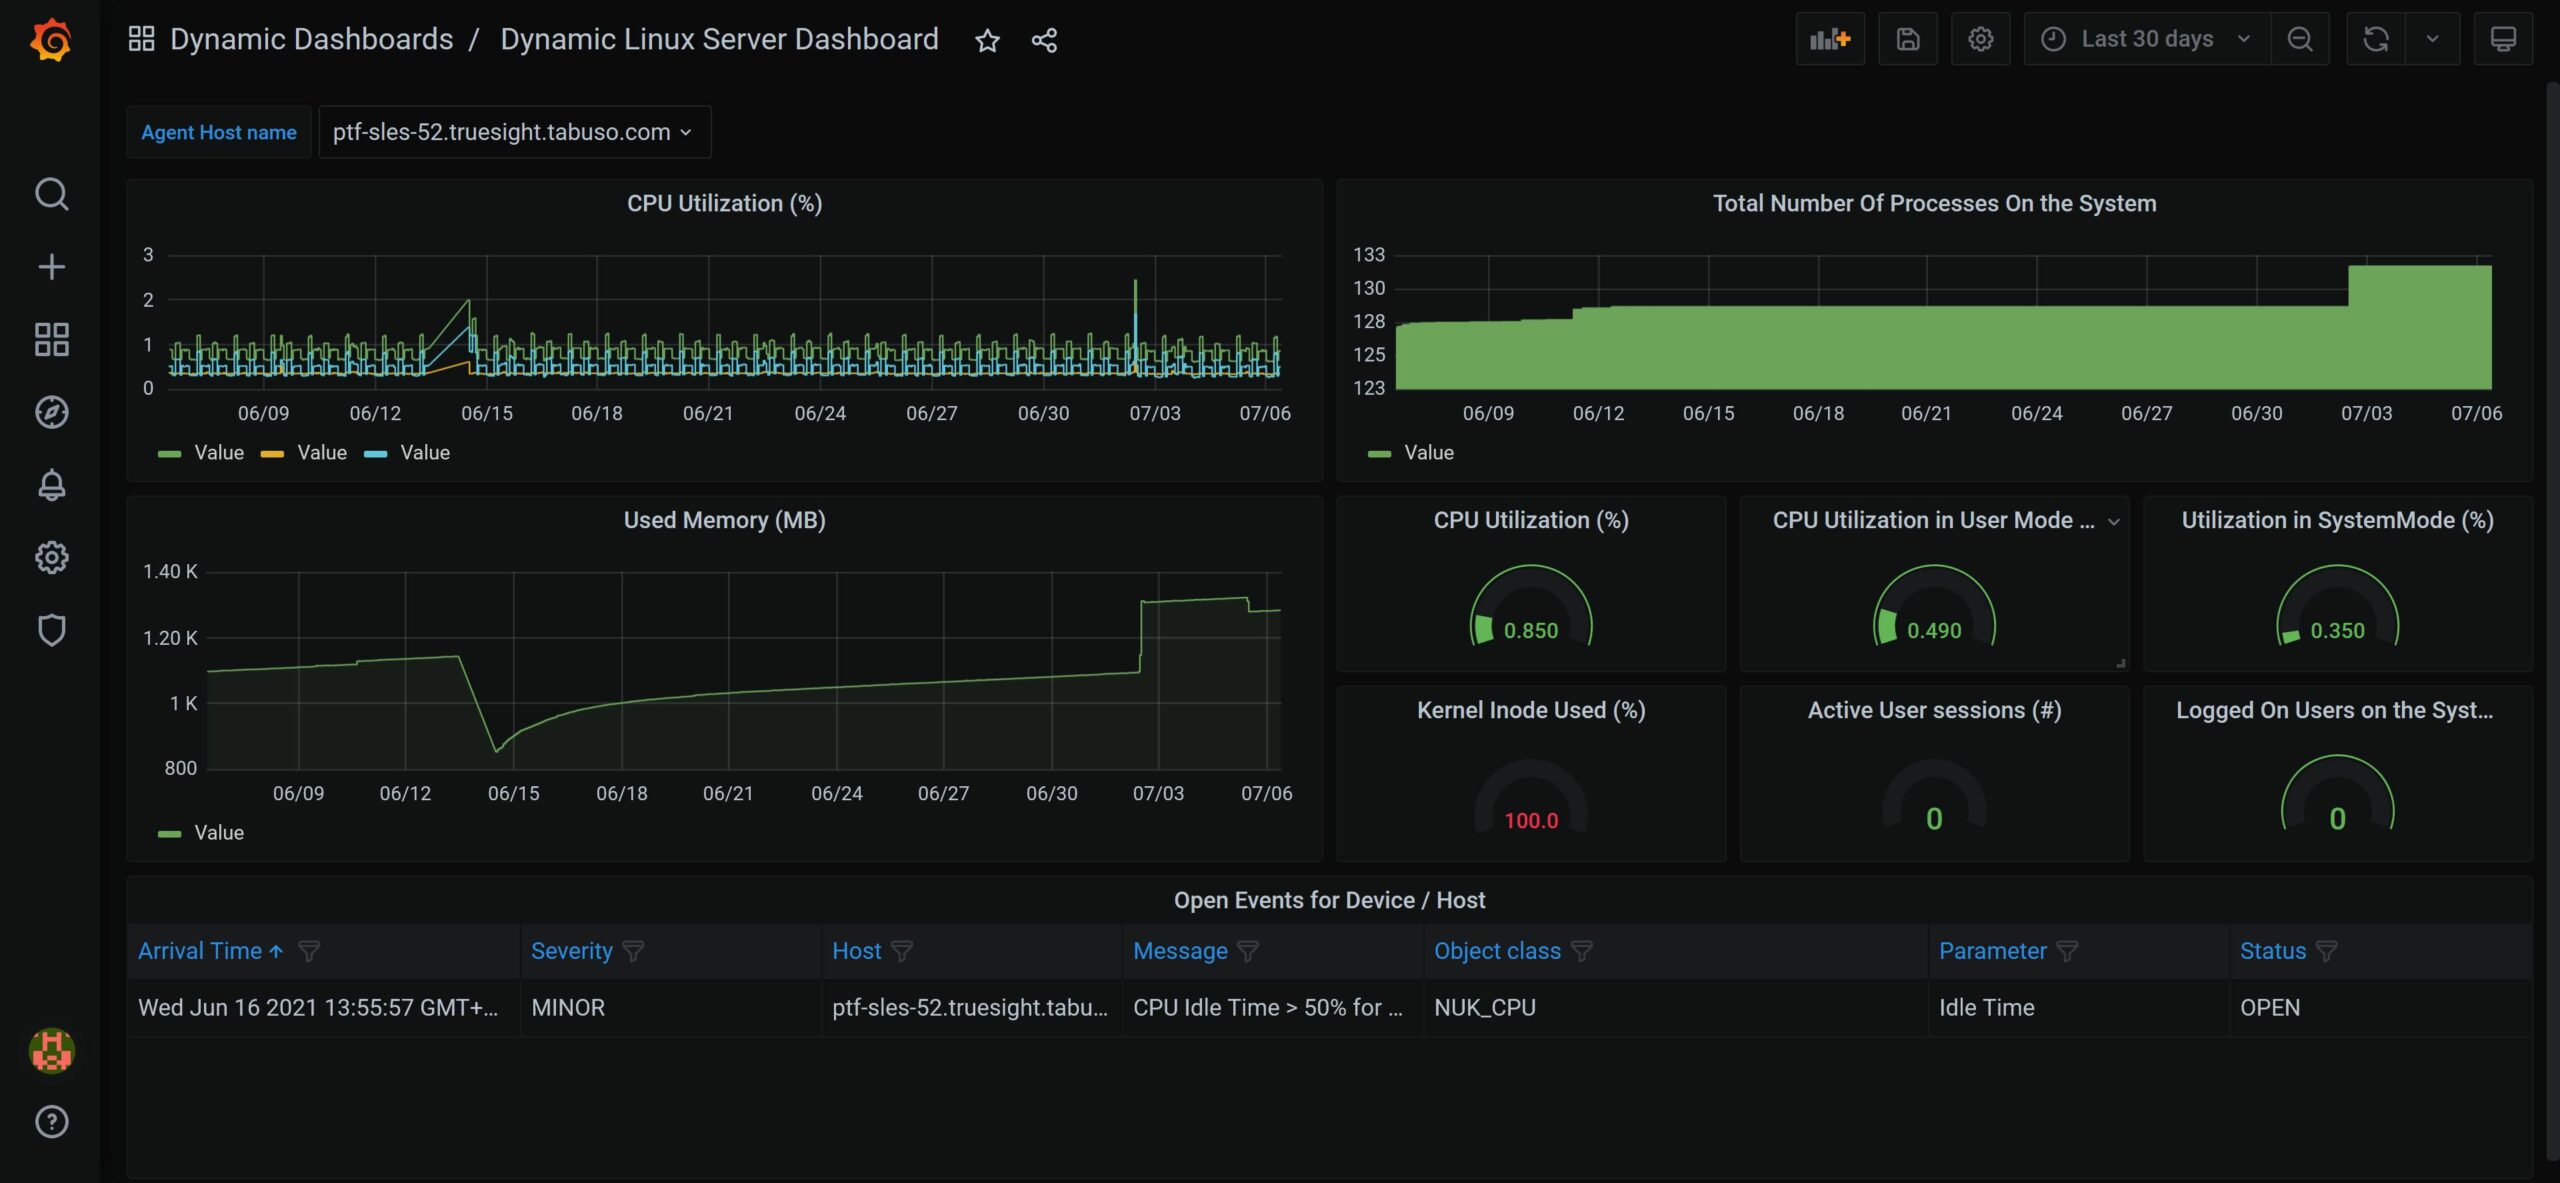
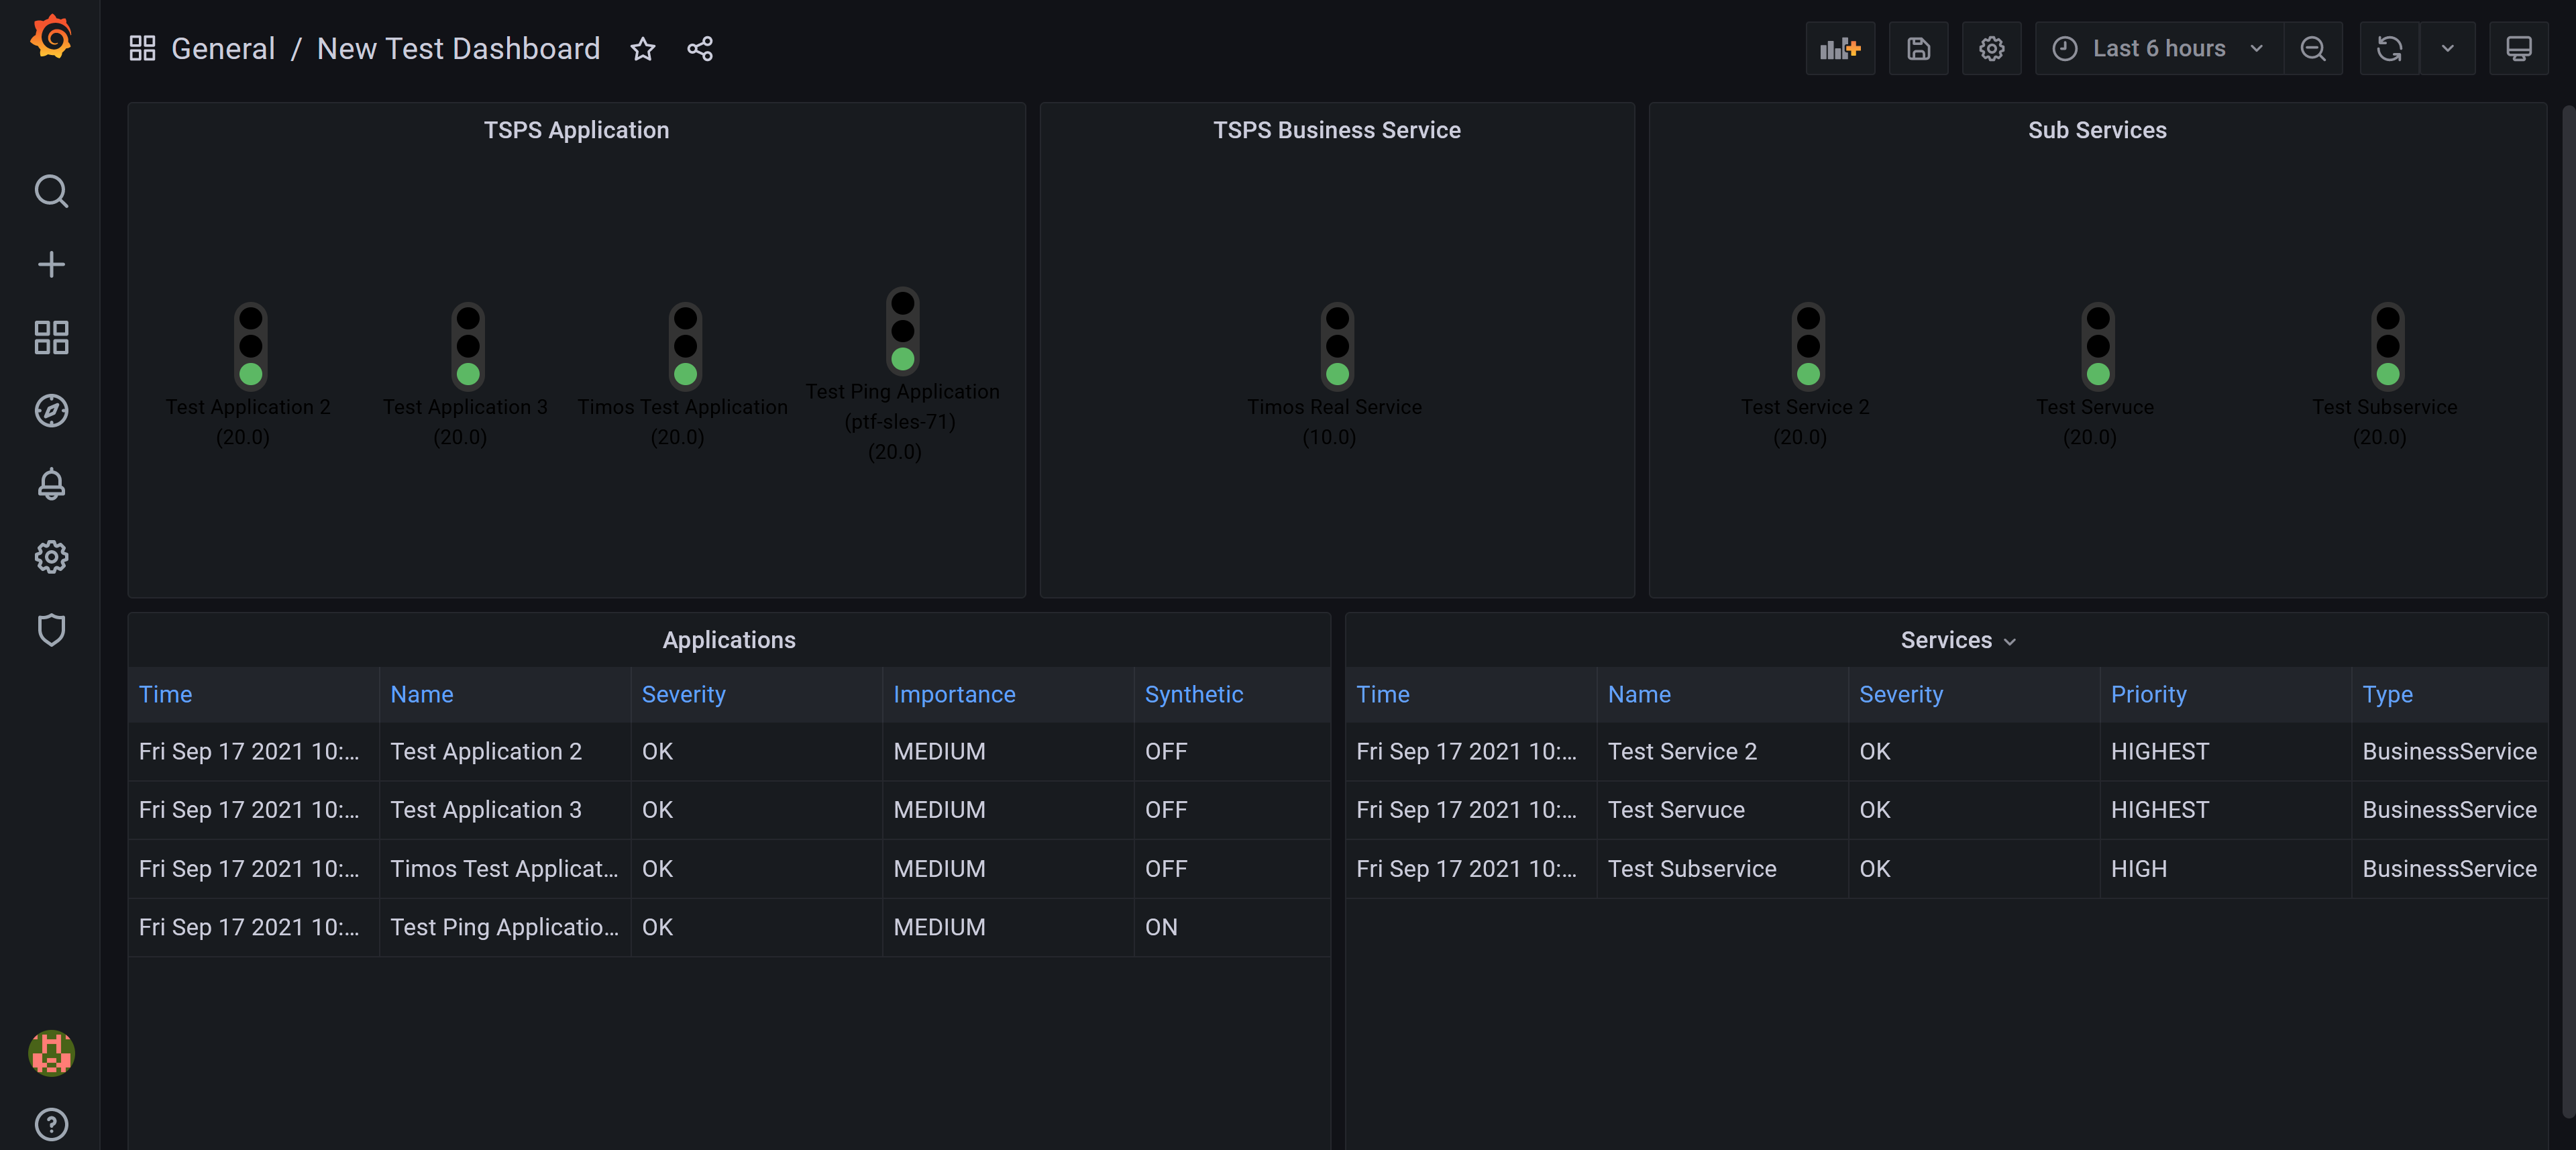
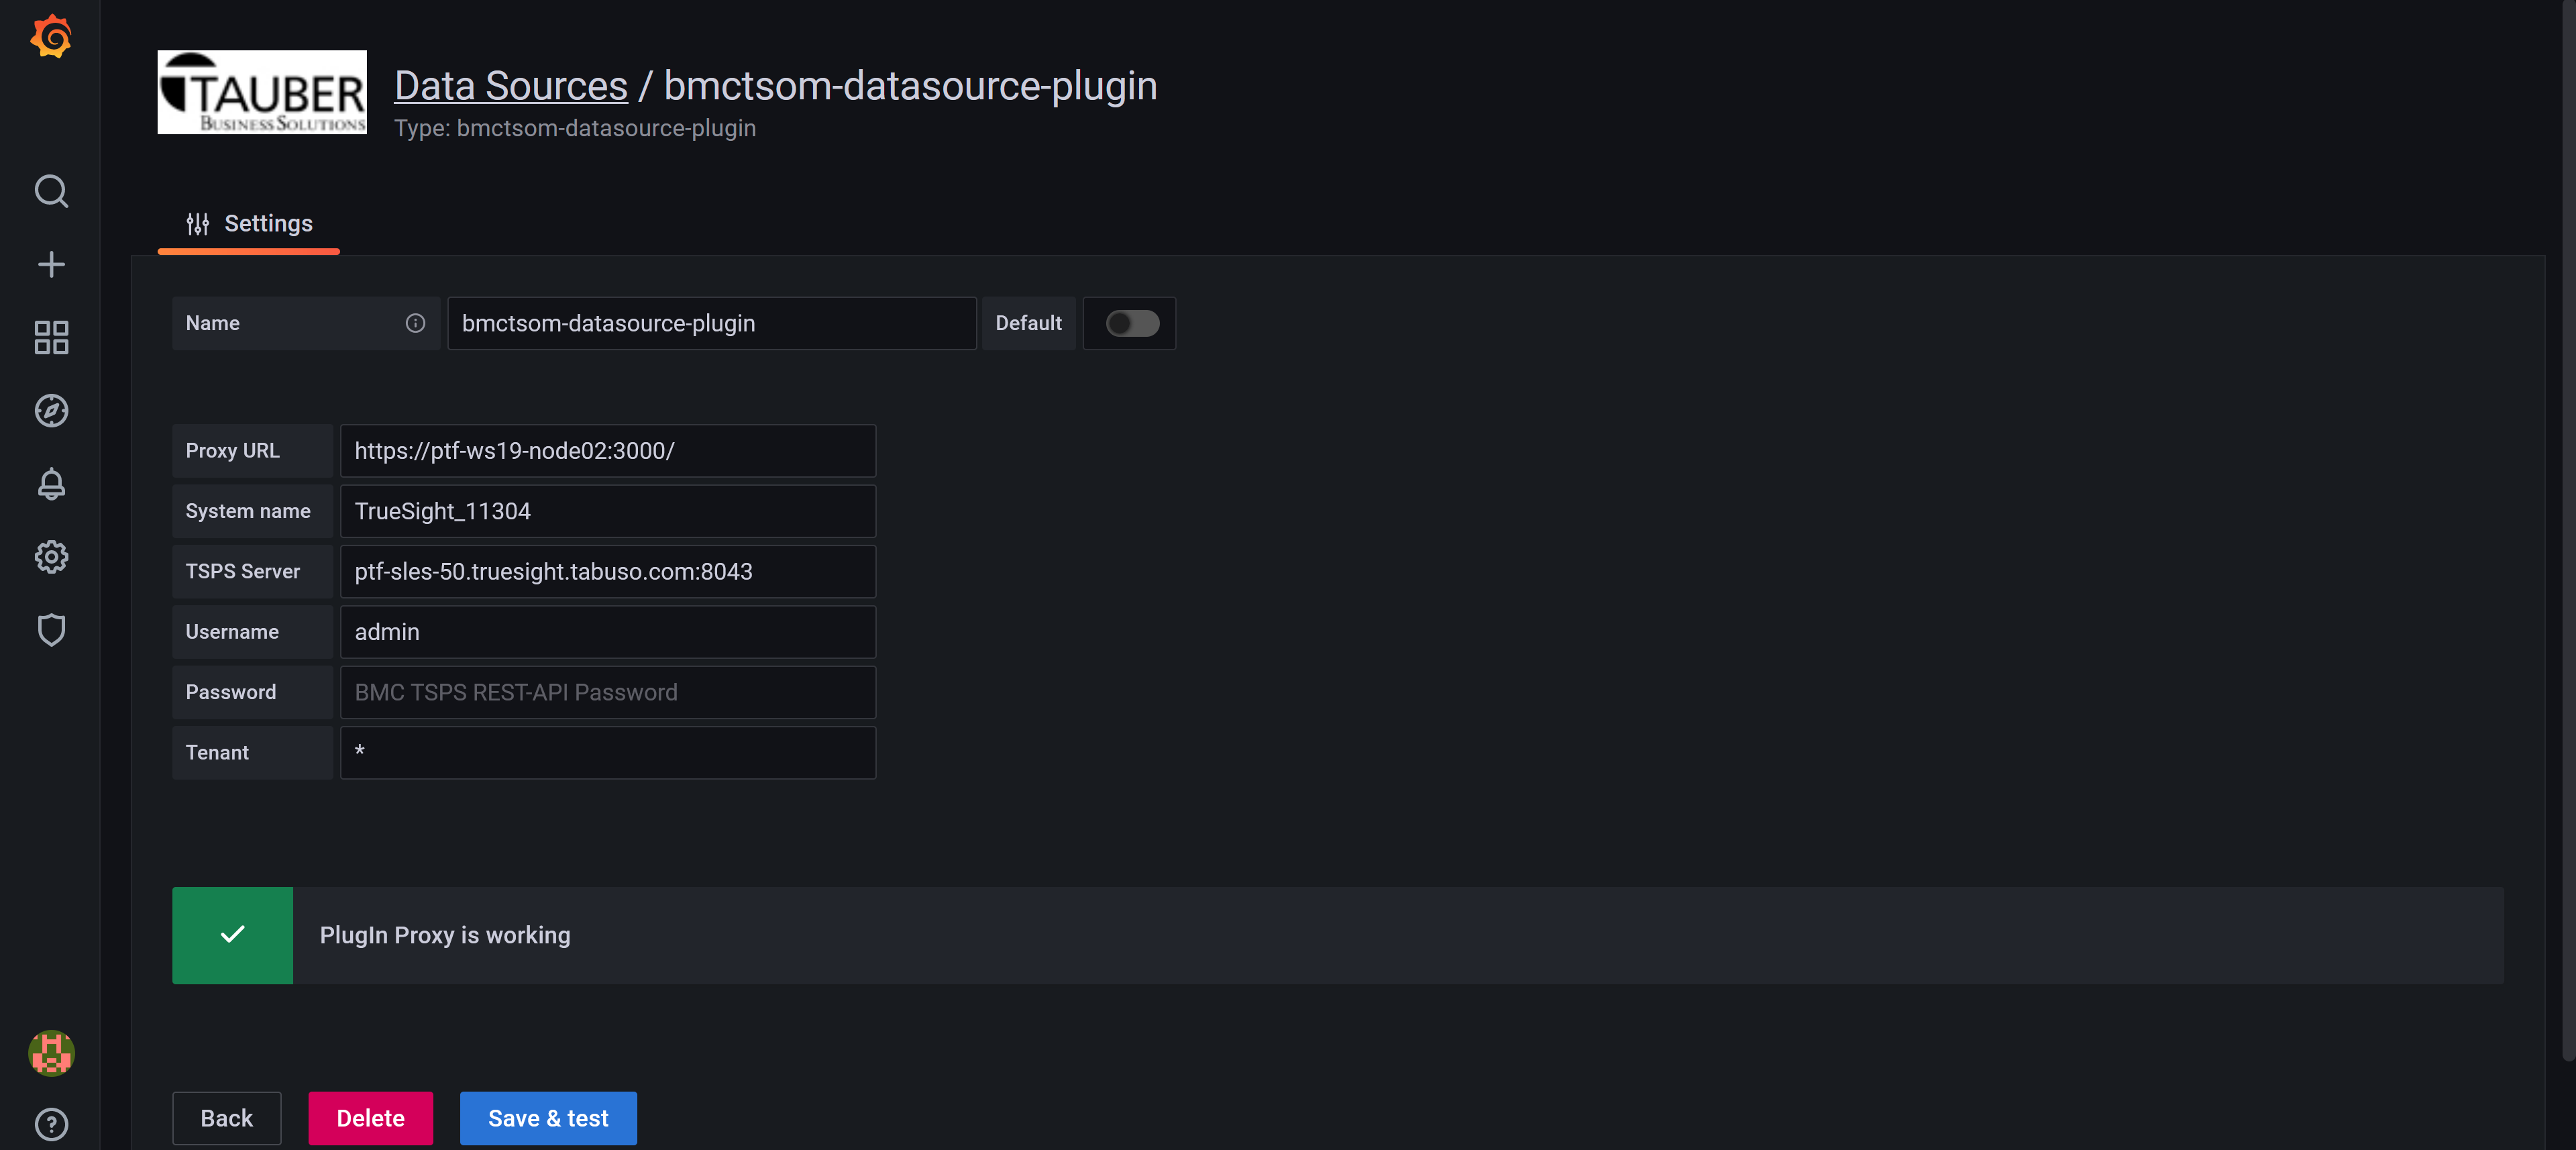
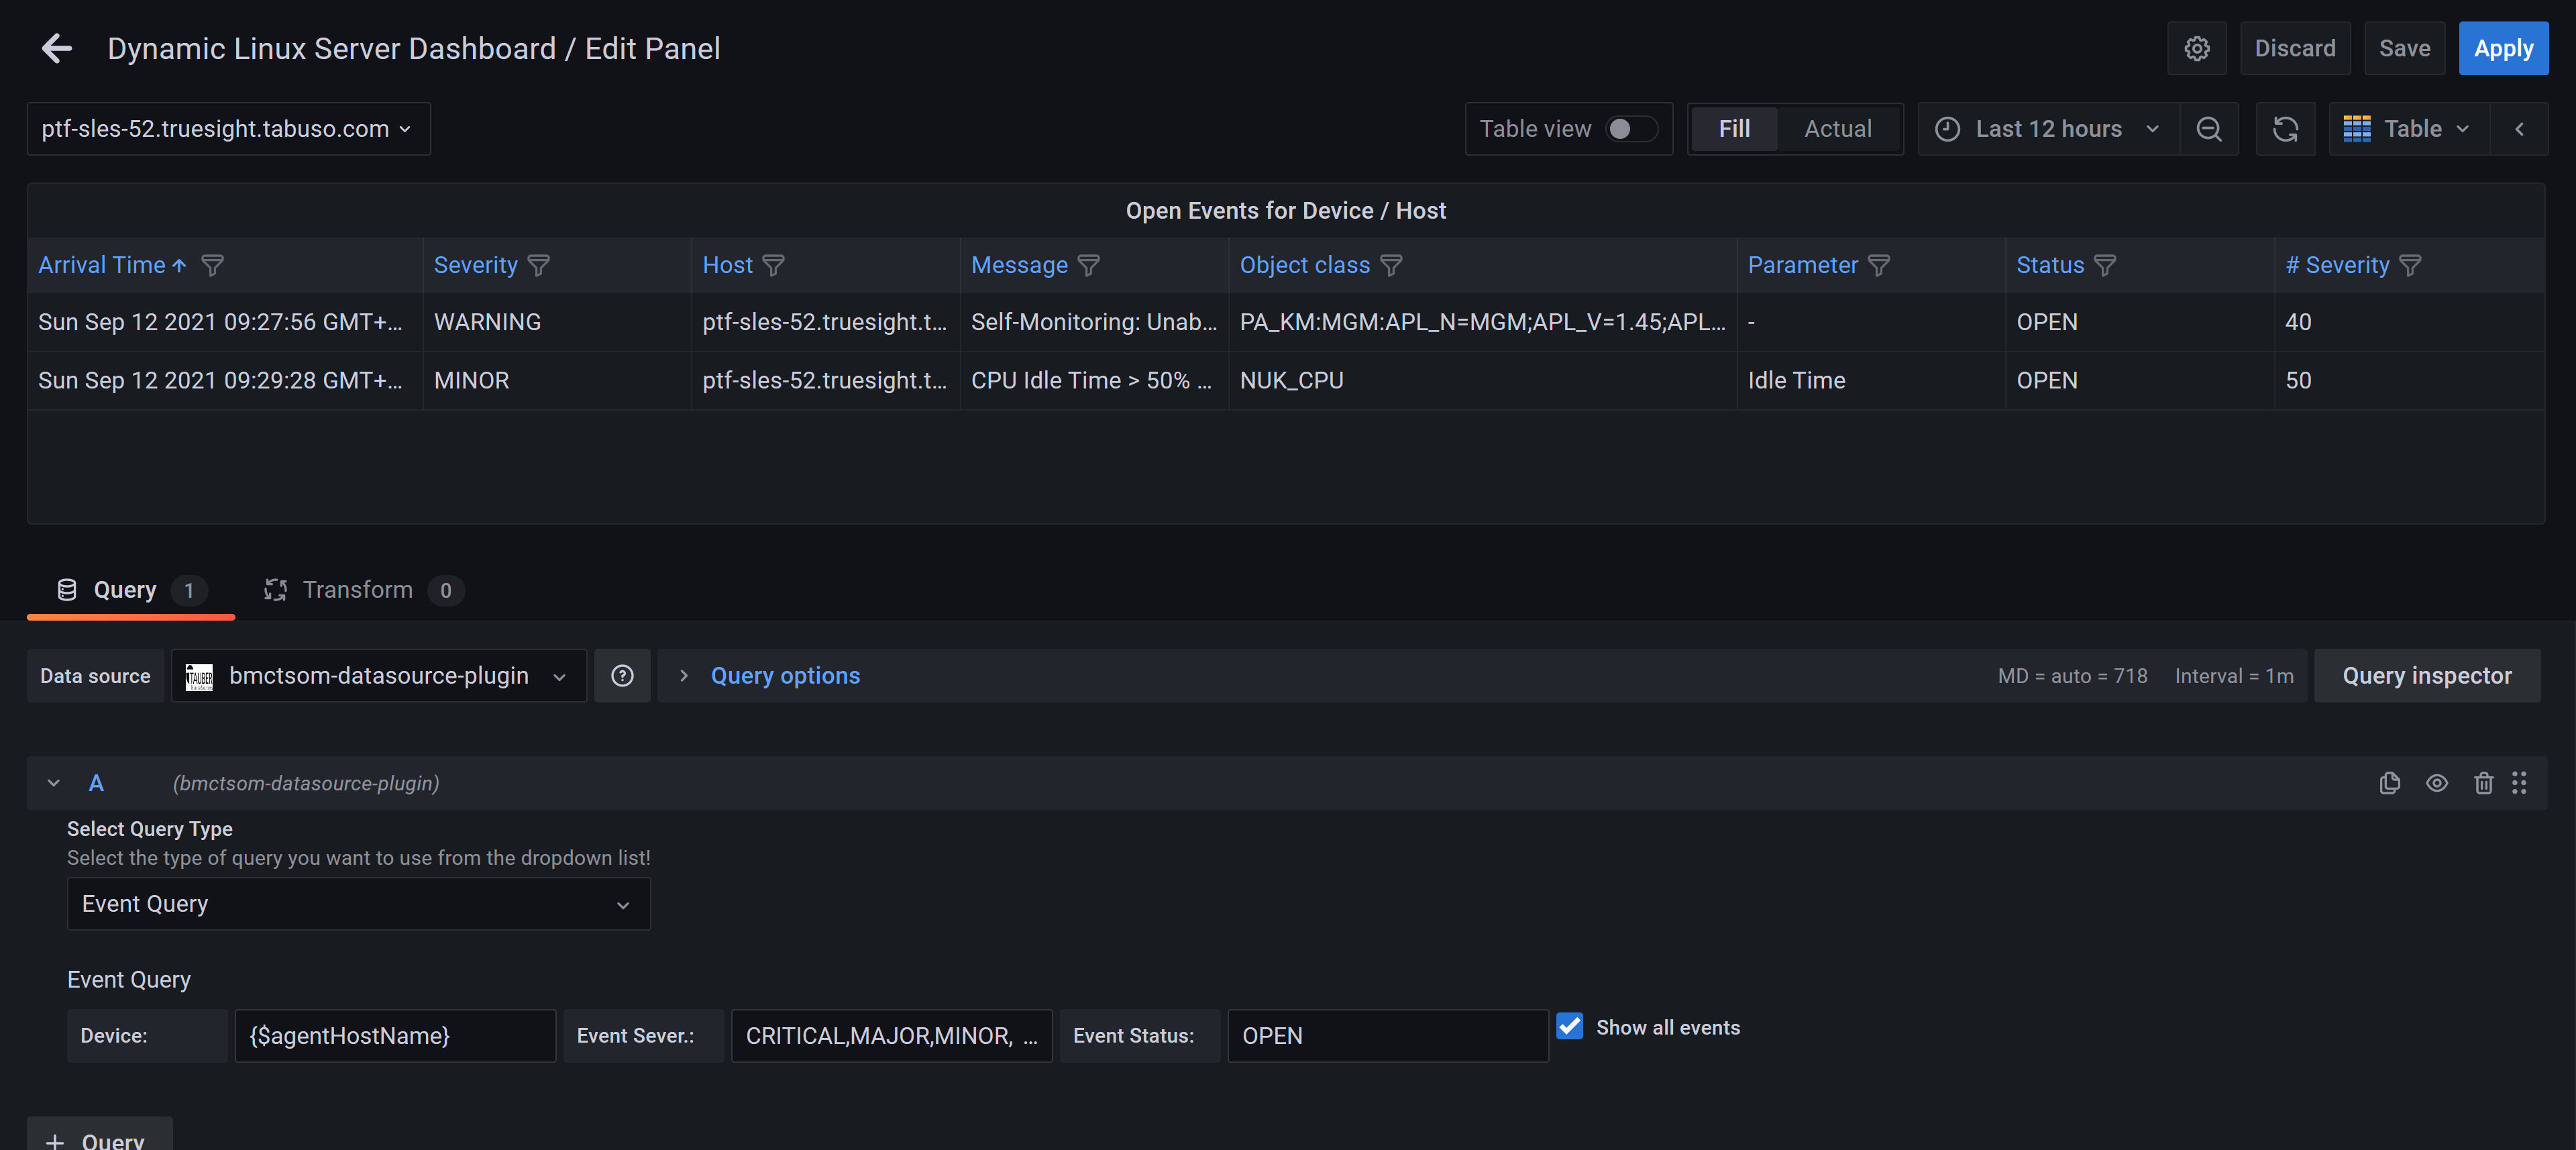
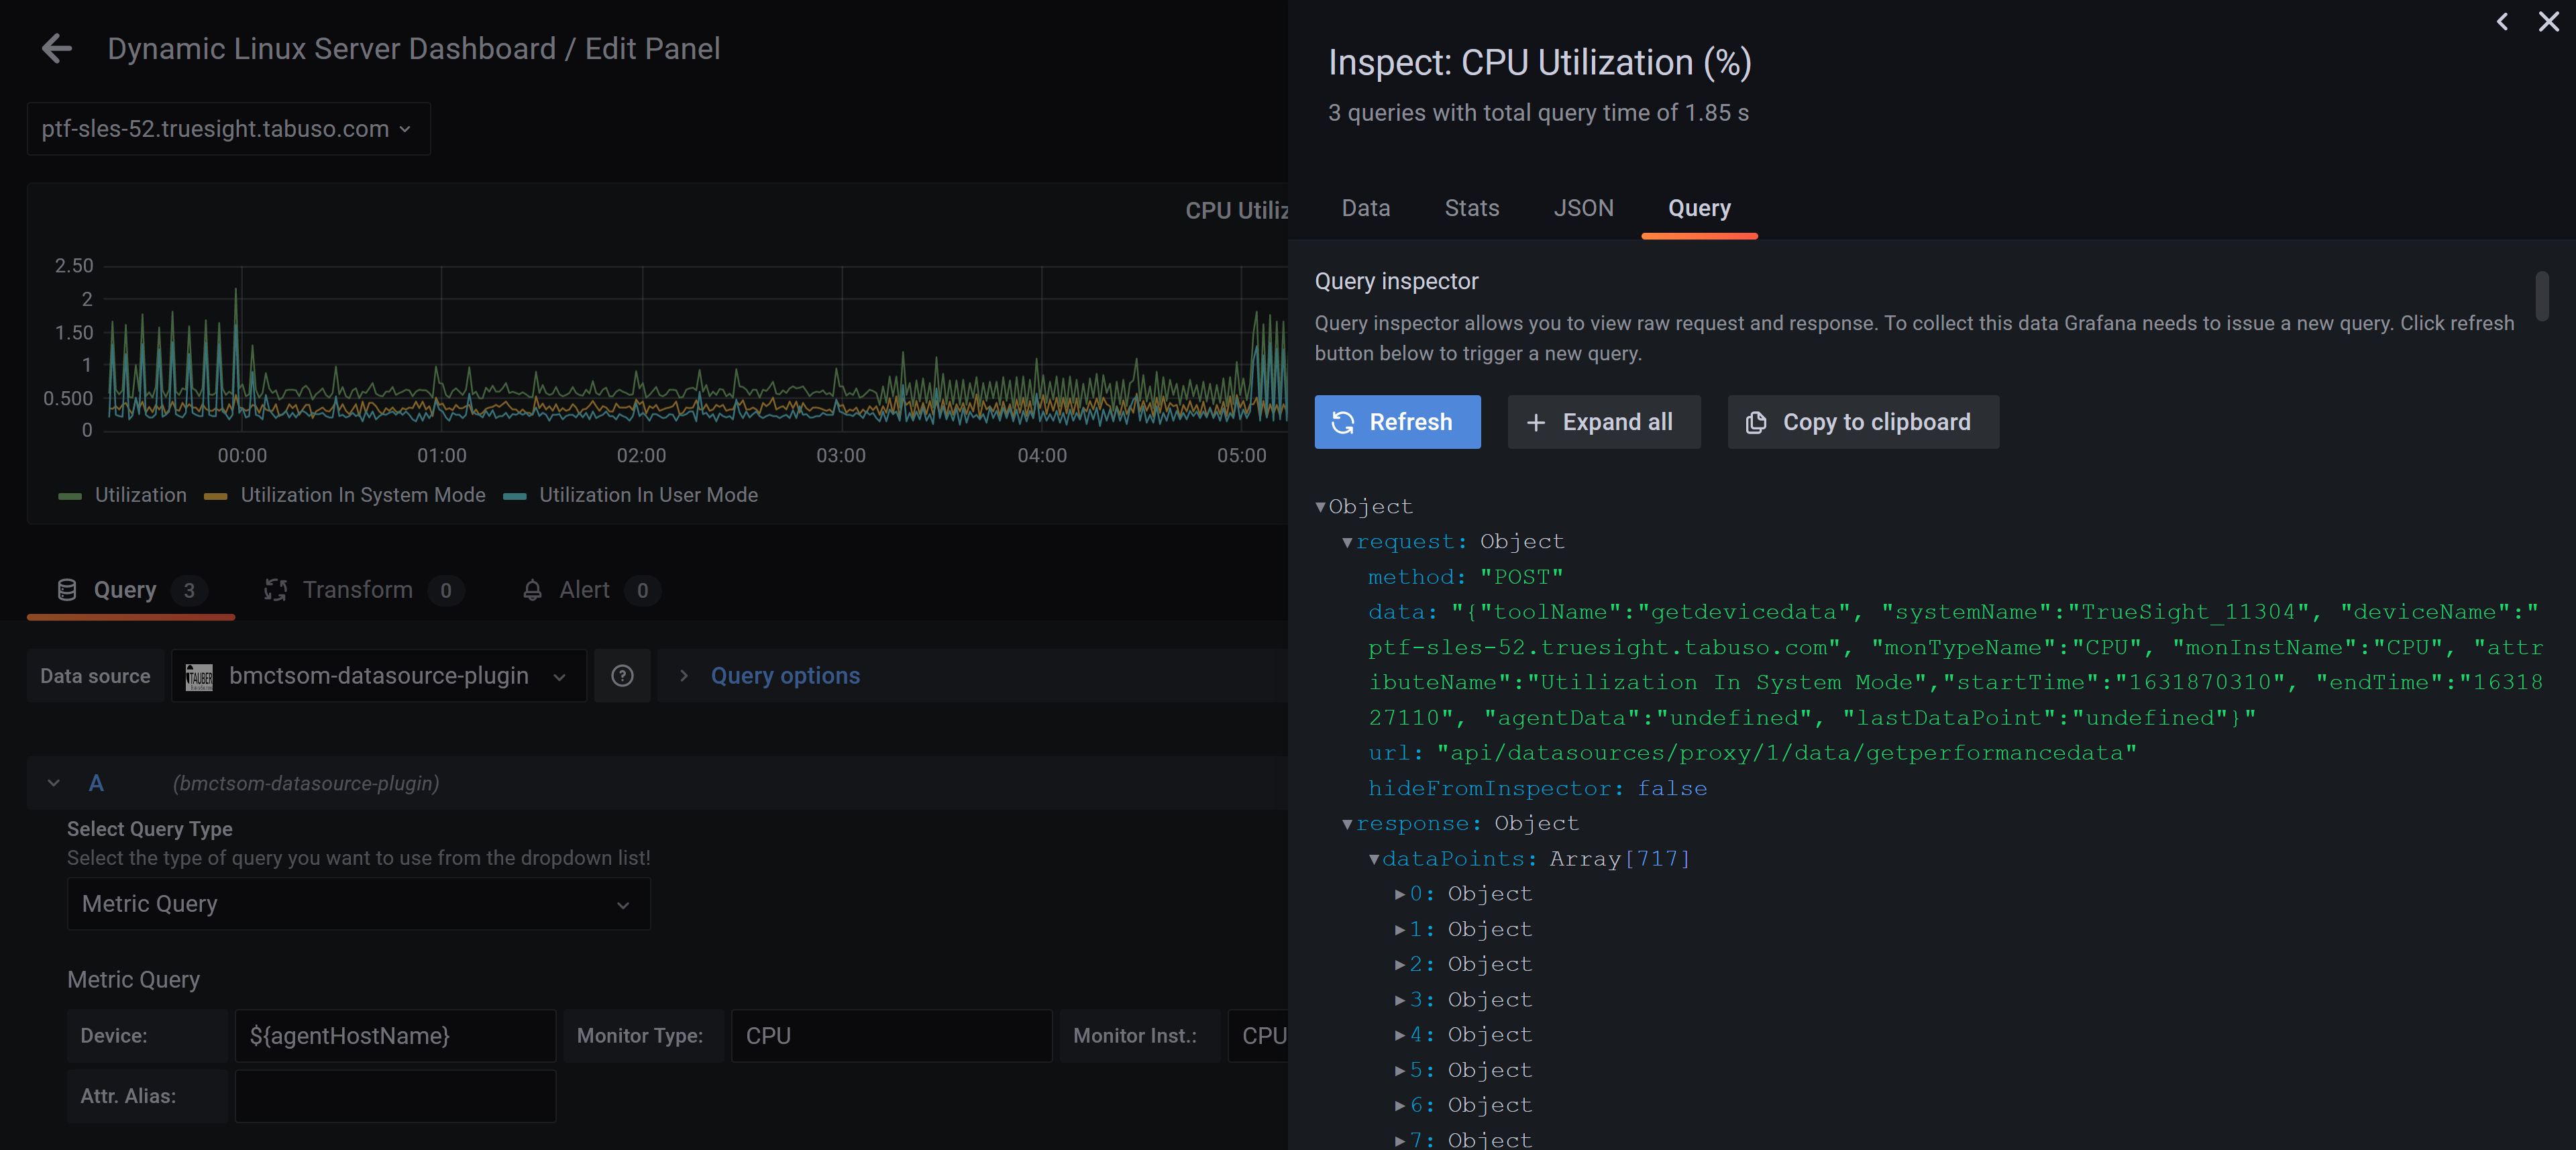
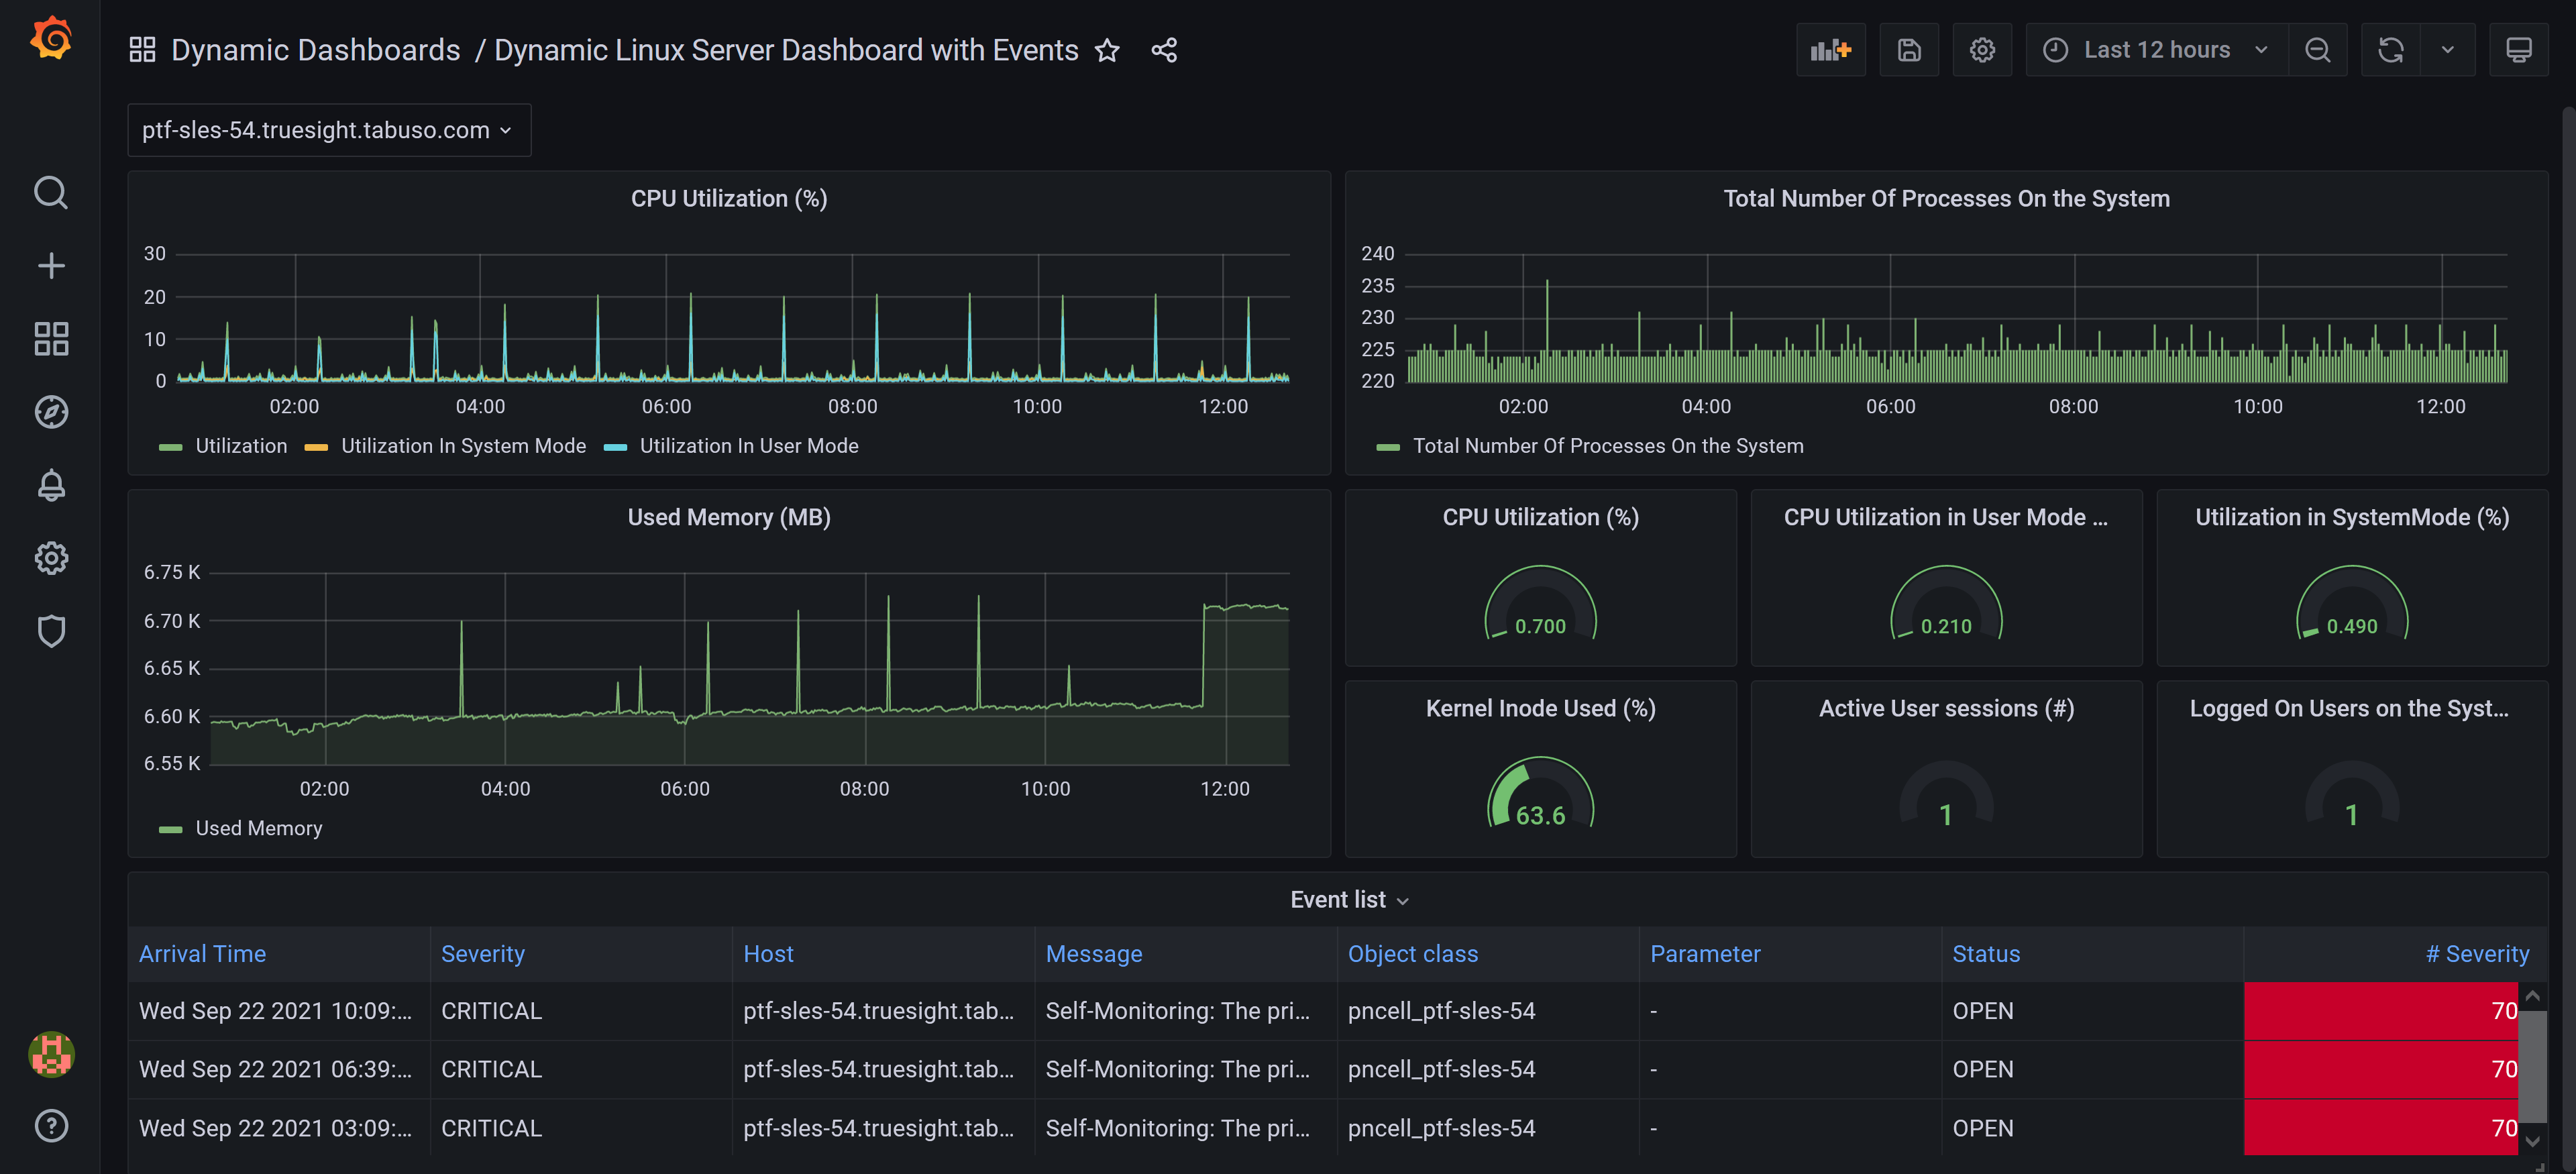
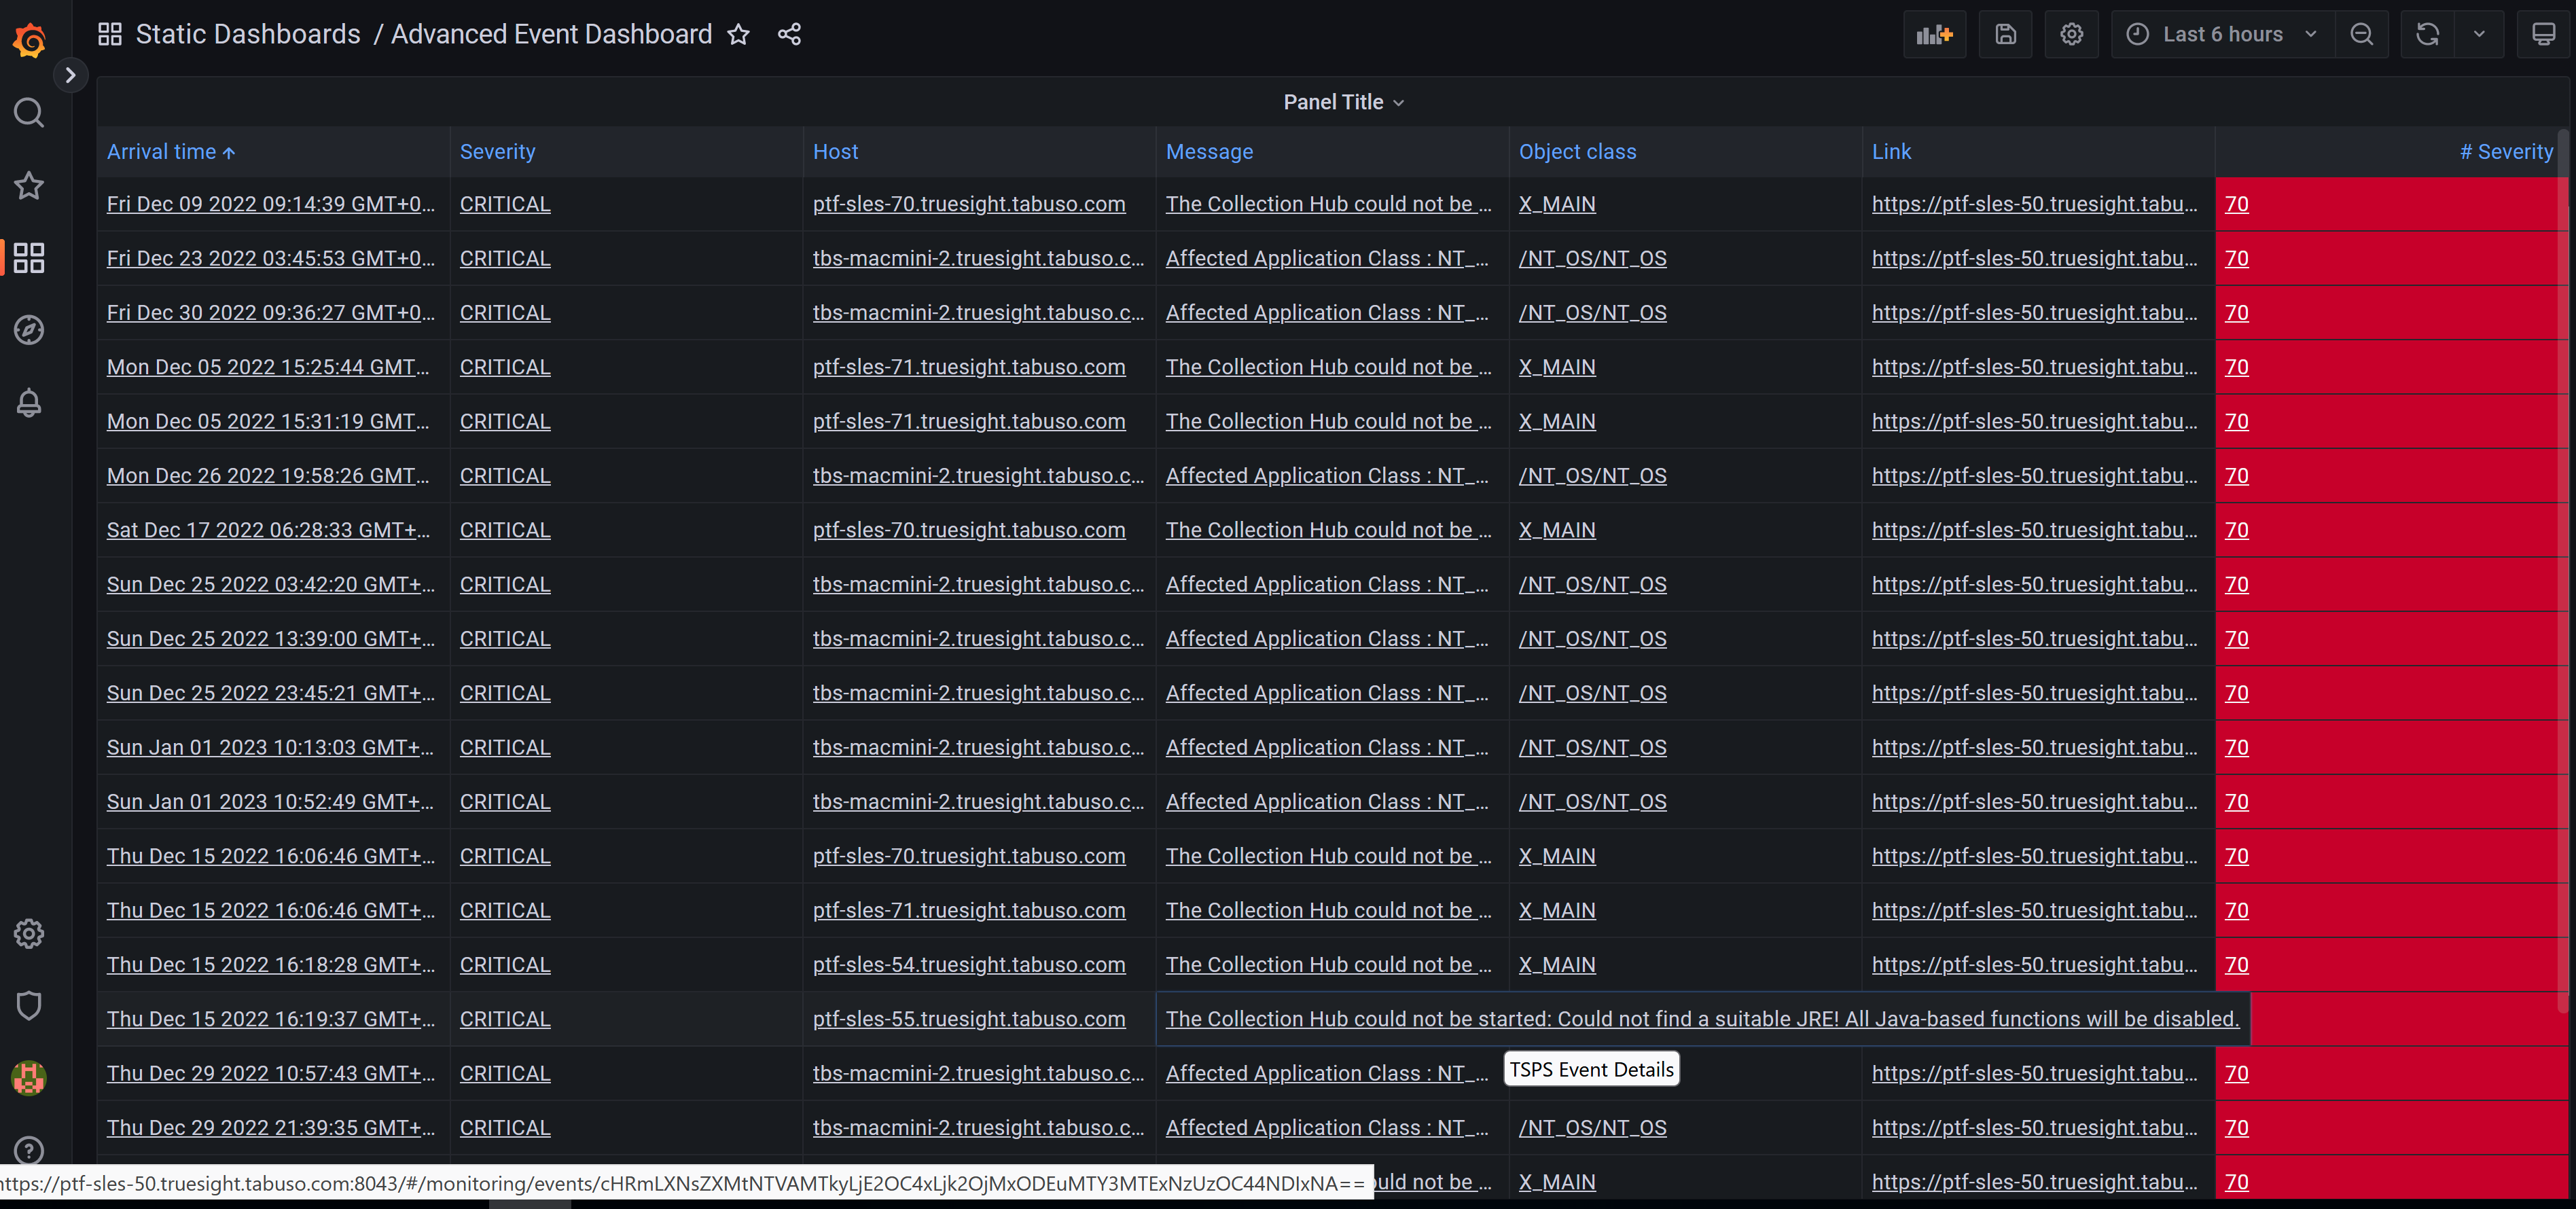
The TAUBER Grafana Integration for BMC TrueSight Operations Manager connects Grafana to the TrueSight Presentation Server REST-API and enables you to create static and / or dynamic Dashboards based on TrueSight Metric, Event, Application and Service Data. The connection is established using a lightweight proxy that can be deployed in a few minutes. The Proxy is used to gather and prepare the data from the Presentation Server and forward it to the Grafana PlugIn.
Solution Value
- Use the Power of Grafana to visualize Metrics, Events, Applications and Services from BMC TrueSight Operations Manager
- Process and analyze Data from BMC TrueSight Operations Manager
- Simple configuration for Graphs and Event lists using Device, Monitor, Instance and Attribute name
- Dashboard Variables for PATROL Agents, Devices, Device Groups, Monitor Types, Monitor Instances and Attributes to create highly dynamic Dashboards
Supported platforms for the Proxy
- Windows 2016 and higher
- SUSE SLES 15 and higher
- Oracle Linux 7.0 and higher
- RedHat Enterprise Linux 8.1 and higher
Supported platforms for the Grafana PlugIn
- Grafana 7.x, 8.x, 9.x, 10.x, 11.x
Read more about TAUBER Grafana Device List Panel PlugIn our latest product for Grafana and TrueSight here!
Click here to go to the Download page and download a Trial version of the Integration!

