We are happy to announce …
TAUBER Grafana Integration
for BMC Helix Operations Manager
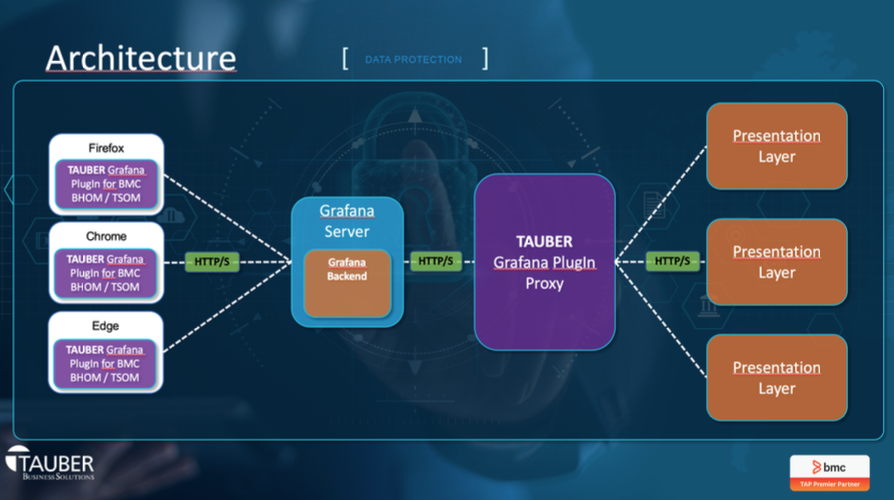
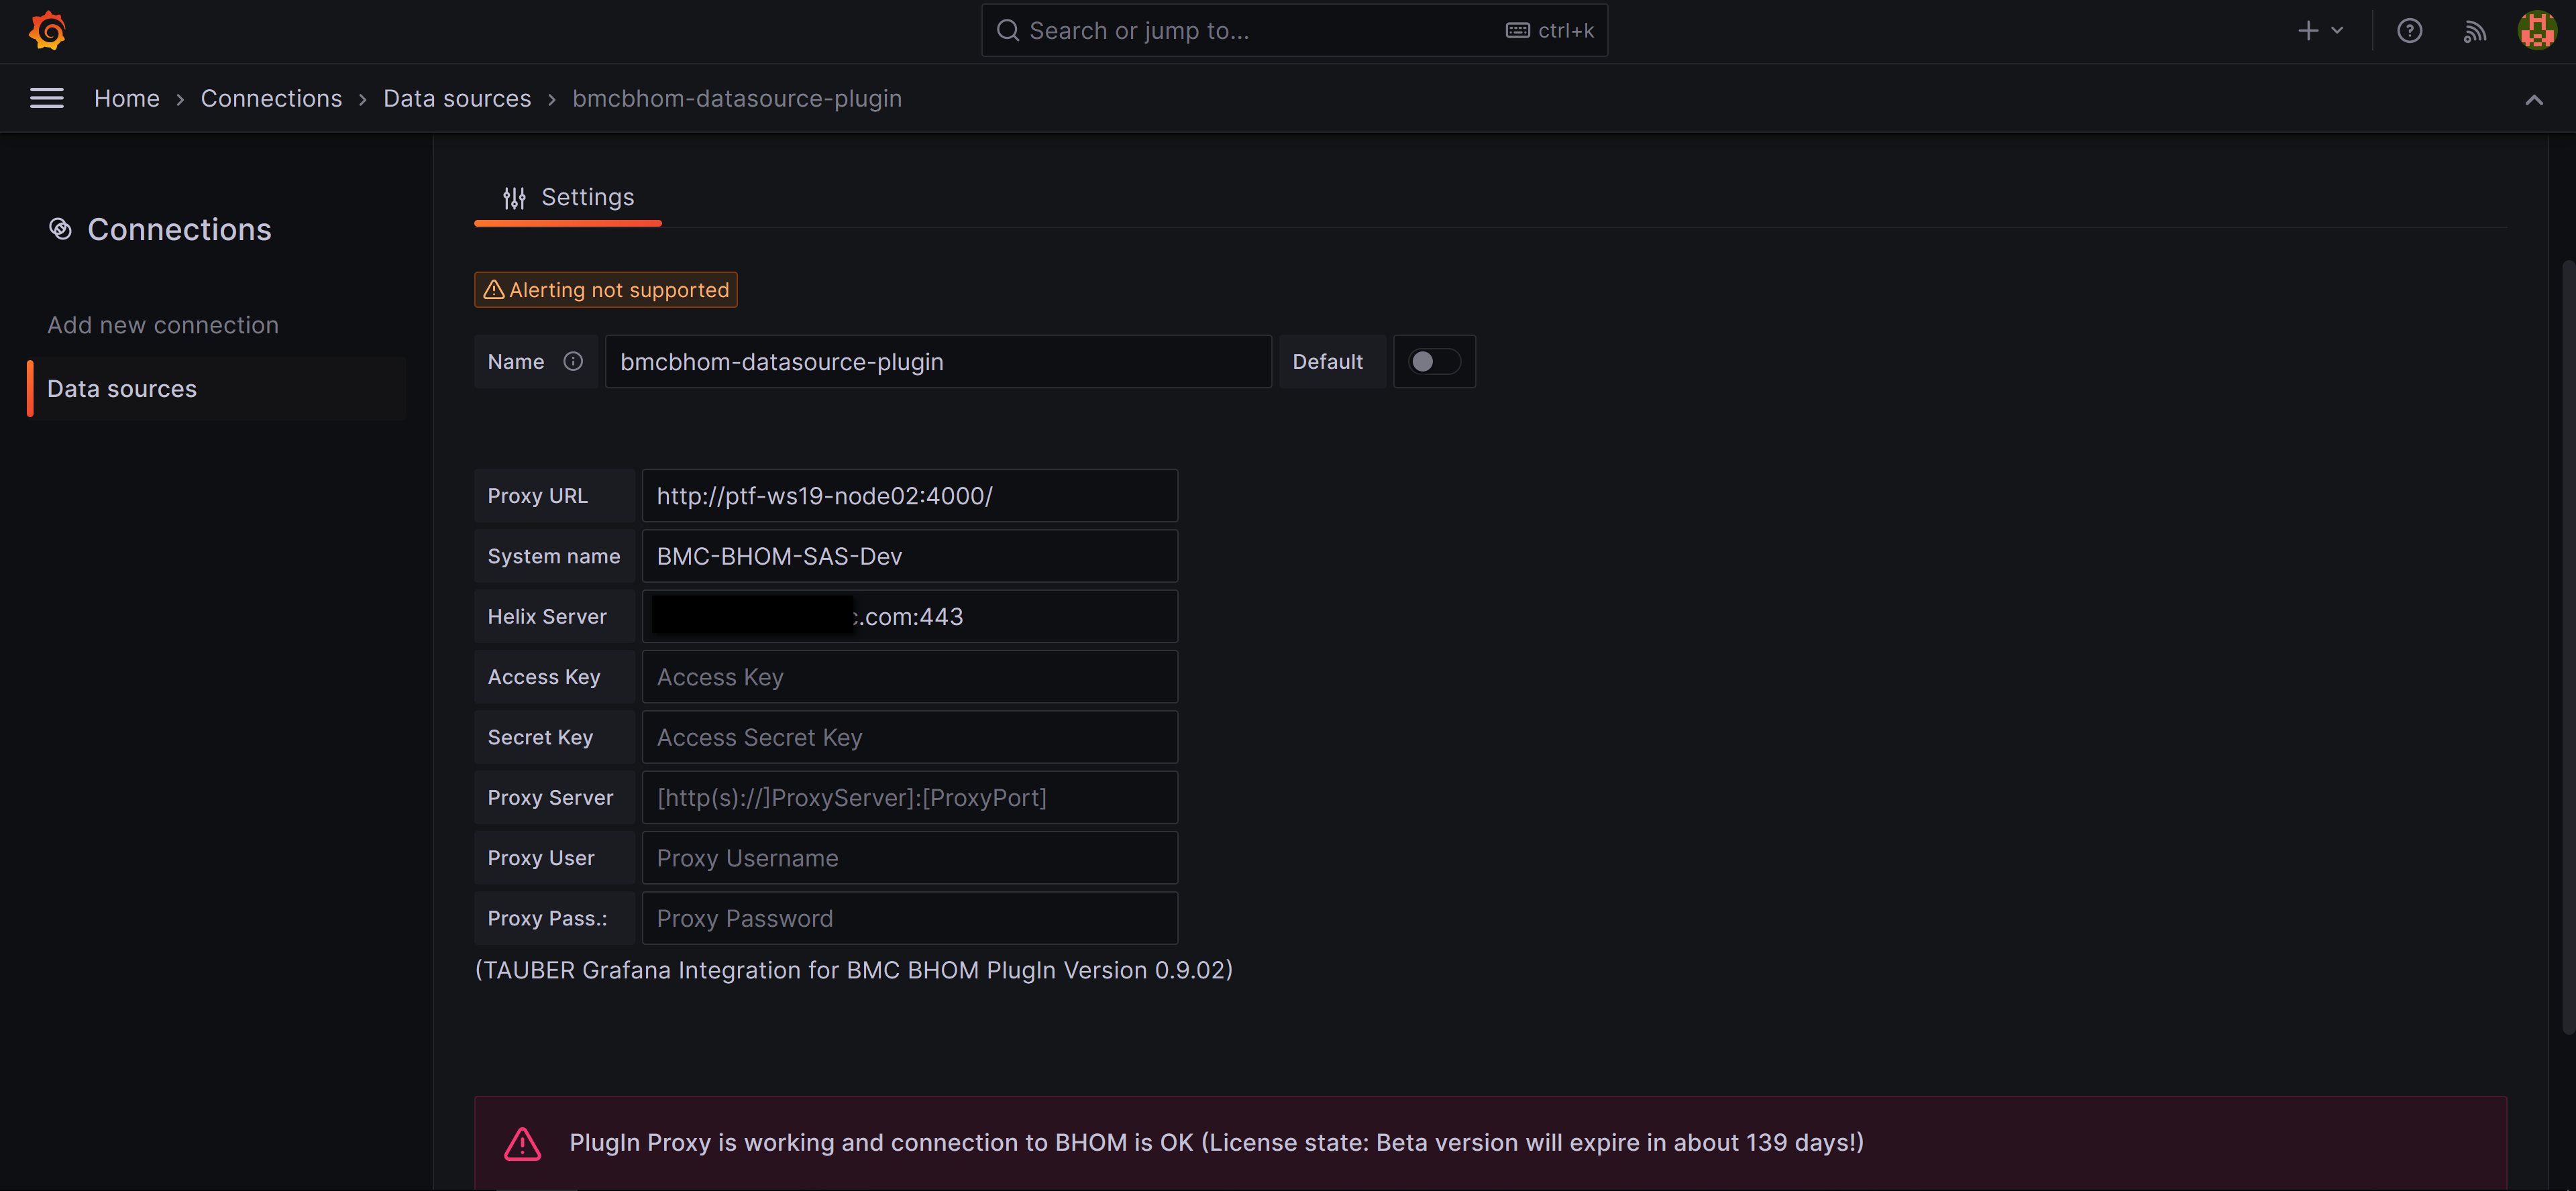
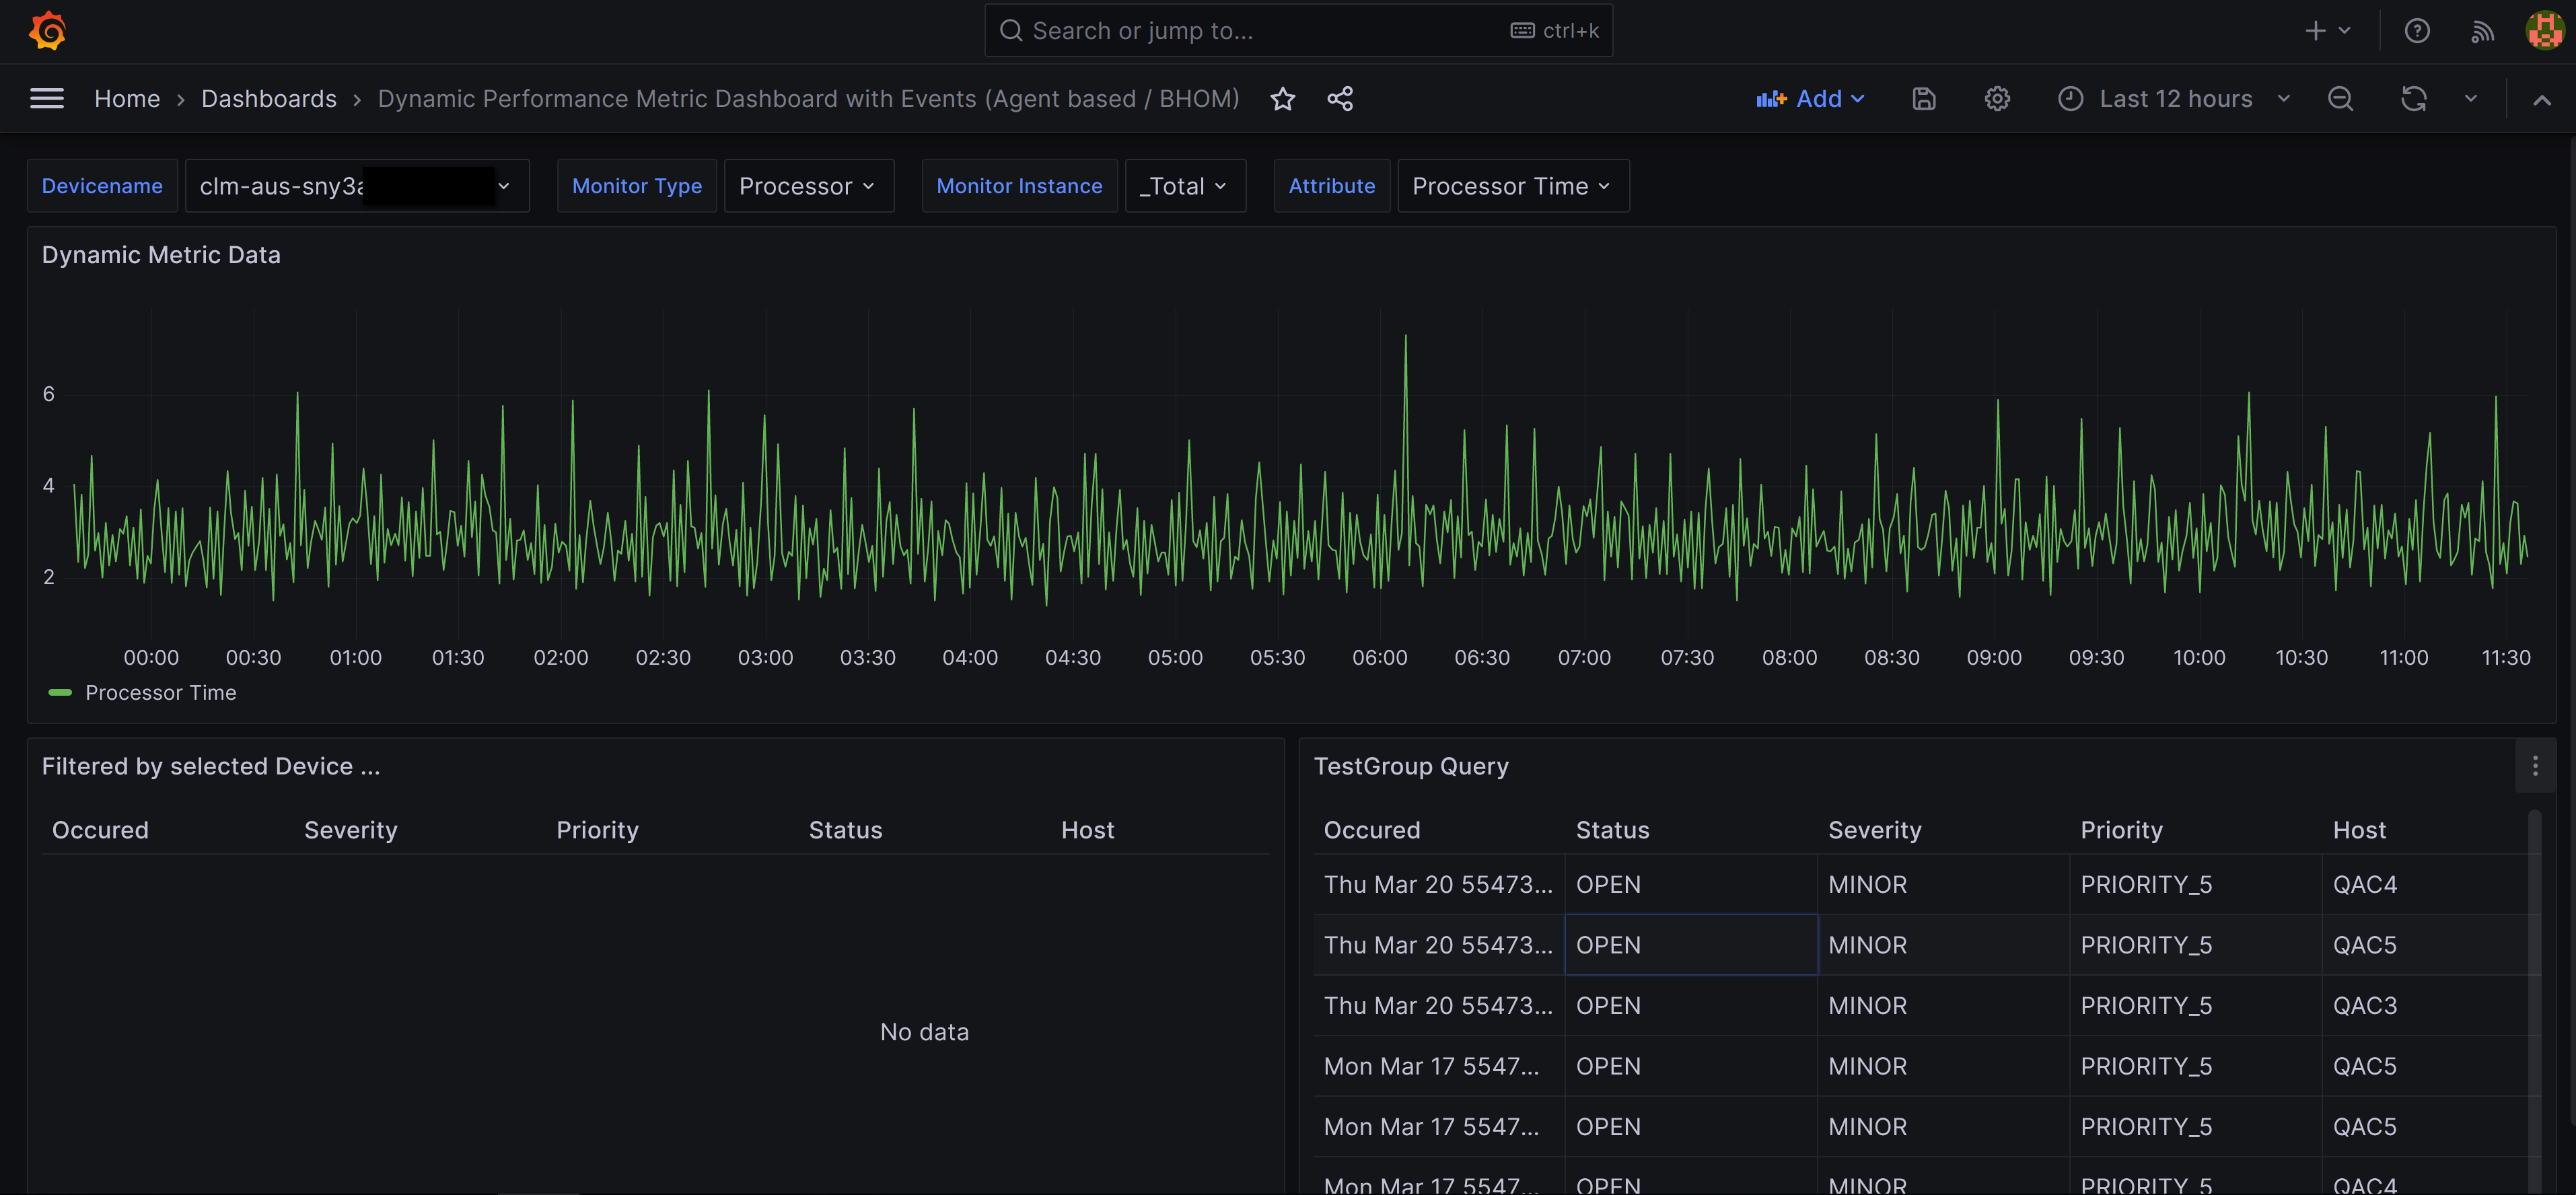
The TAUBER Grafana Integration for BMC Helix Operations Manager connects Grafana to the Presentation Layer REST-API and enables you to create static and / or dynamic Dashboards based on Helix Metric and Event Data. The connection is established using a lightweight proxy that can be deployed in a few minutes. The Proxy is used to gather and prepare the data from the Presentation Server and forward it to the Grafana PlugIn.
Solution Value
- Use the Power of Grafana outside the Helix Platform to visualize Metrics and Events from BMC Helix Operations Manager
- Process and analyze Data from BMC Helix Operations Manager
- Simple configuration for Graphs and Event lists using Device, Monitor, Instance and Attribute name
- Dashboard Variables for PATROL Agents, Devices, Monitor Types, Monitor Instances and Attributes to create highly dynamic Dashboards
Supported platforms for the Proxy
- Windows 2016 and higher
- SUSE SLES 15 and higher
- Oracle Linux 7.0 and higher
- RedHat Enterprise Linux 8.1 and higher
Supported platforms for the Grafana PlugIn
- Grafana 7.x, 8.x, 9.x, 10.x
Click here to go to the Download page and download a Trial version of the Integration!


