TAUBER Device List Dashlet
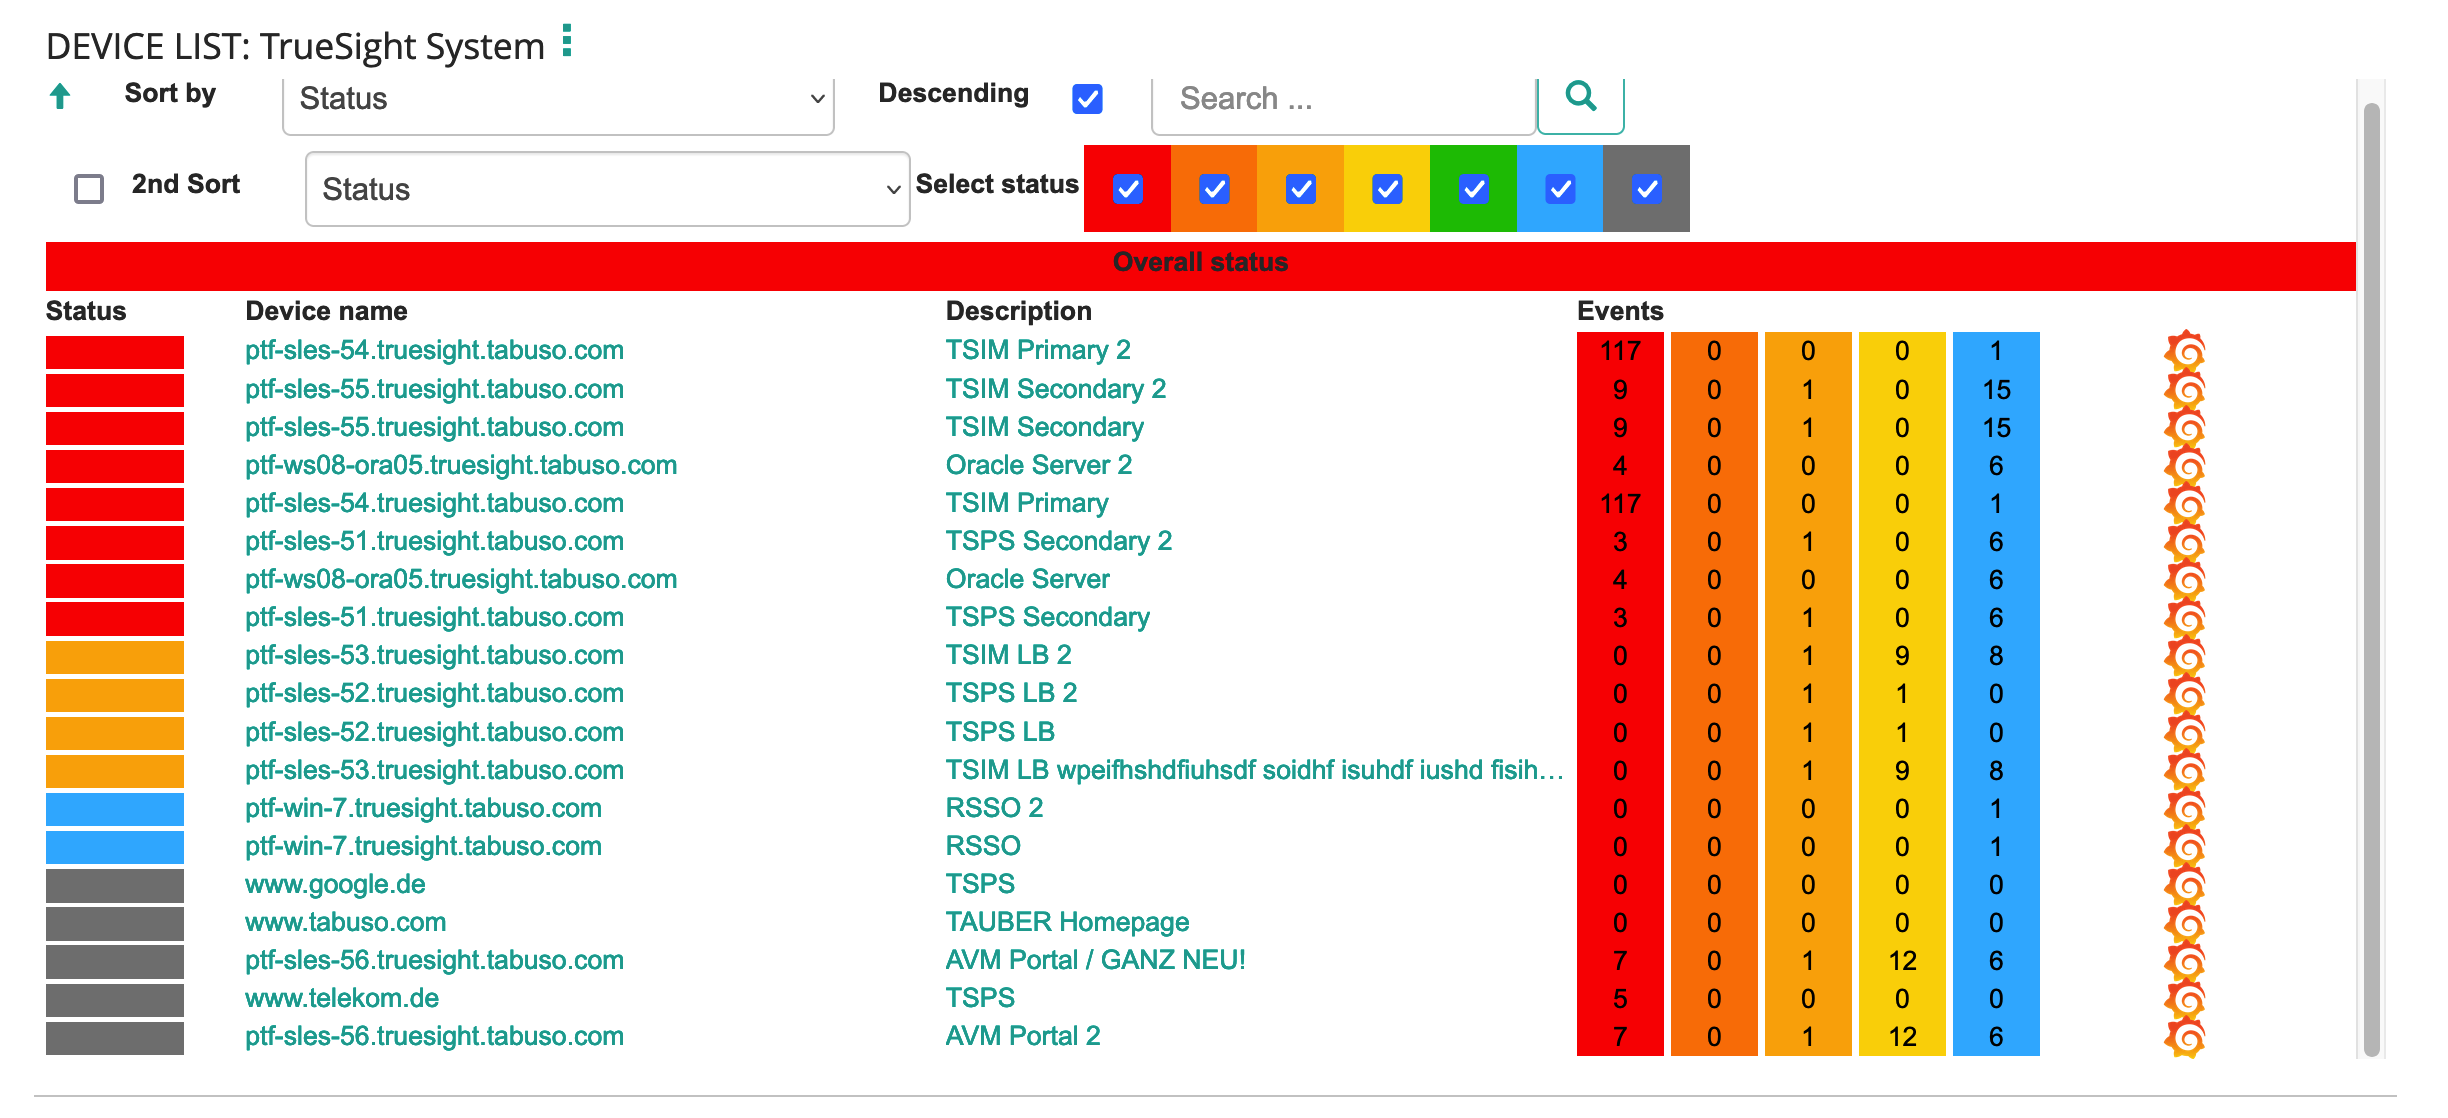
The Device List Dashlet is used to create a list of Devices. Each Device can have a description e.g. Application Server #1. The Dashlet shows the devices in a table format and the user can navigate from the Dashboard directly into the Devices Monitor Tab by clicking on the Devices name or the description. Next to the description there is an over all status and the number of open events displayed. By clicking on the number of events the User is send to the Event tab of this Devices view.
Features & Functions
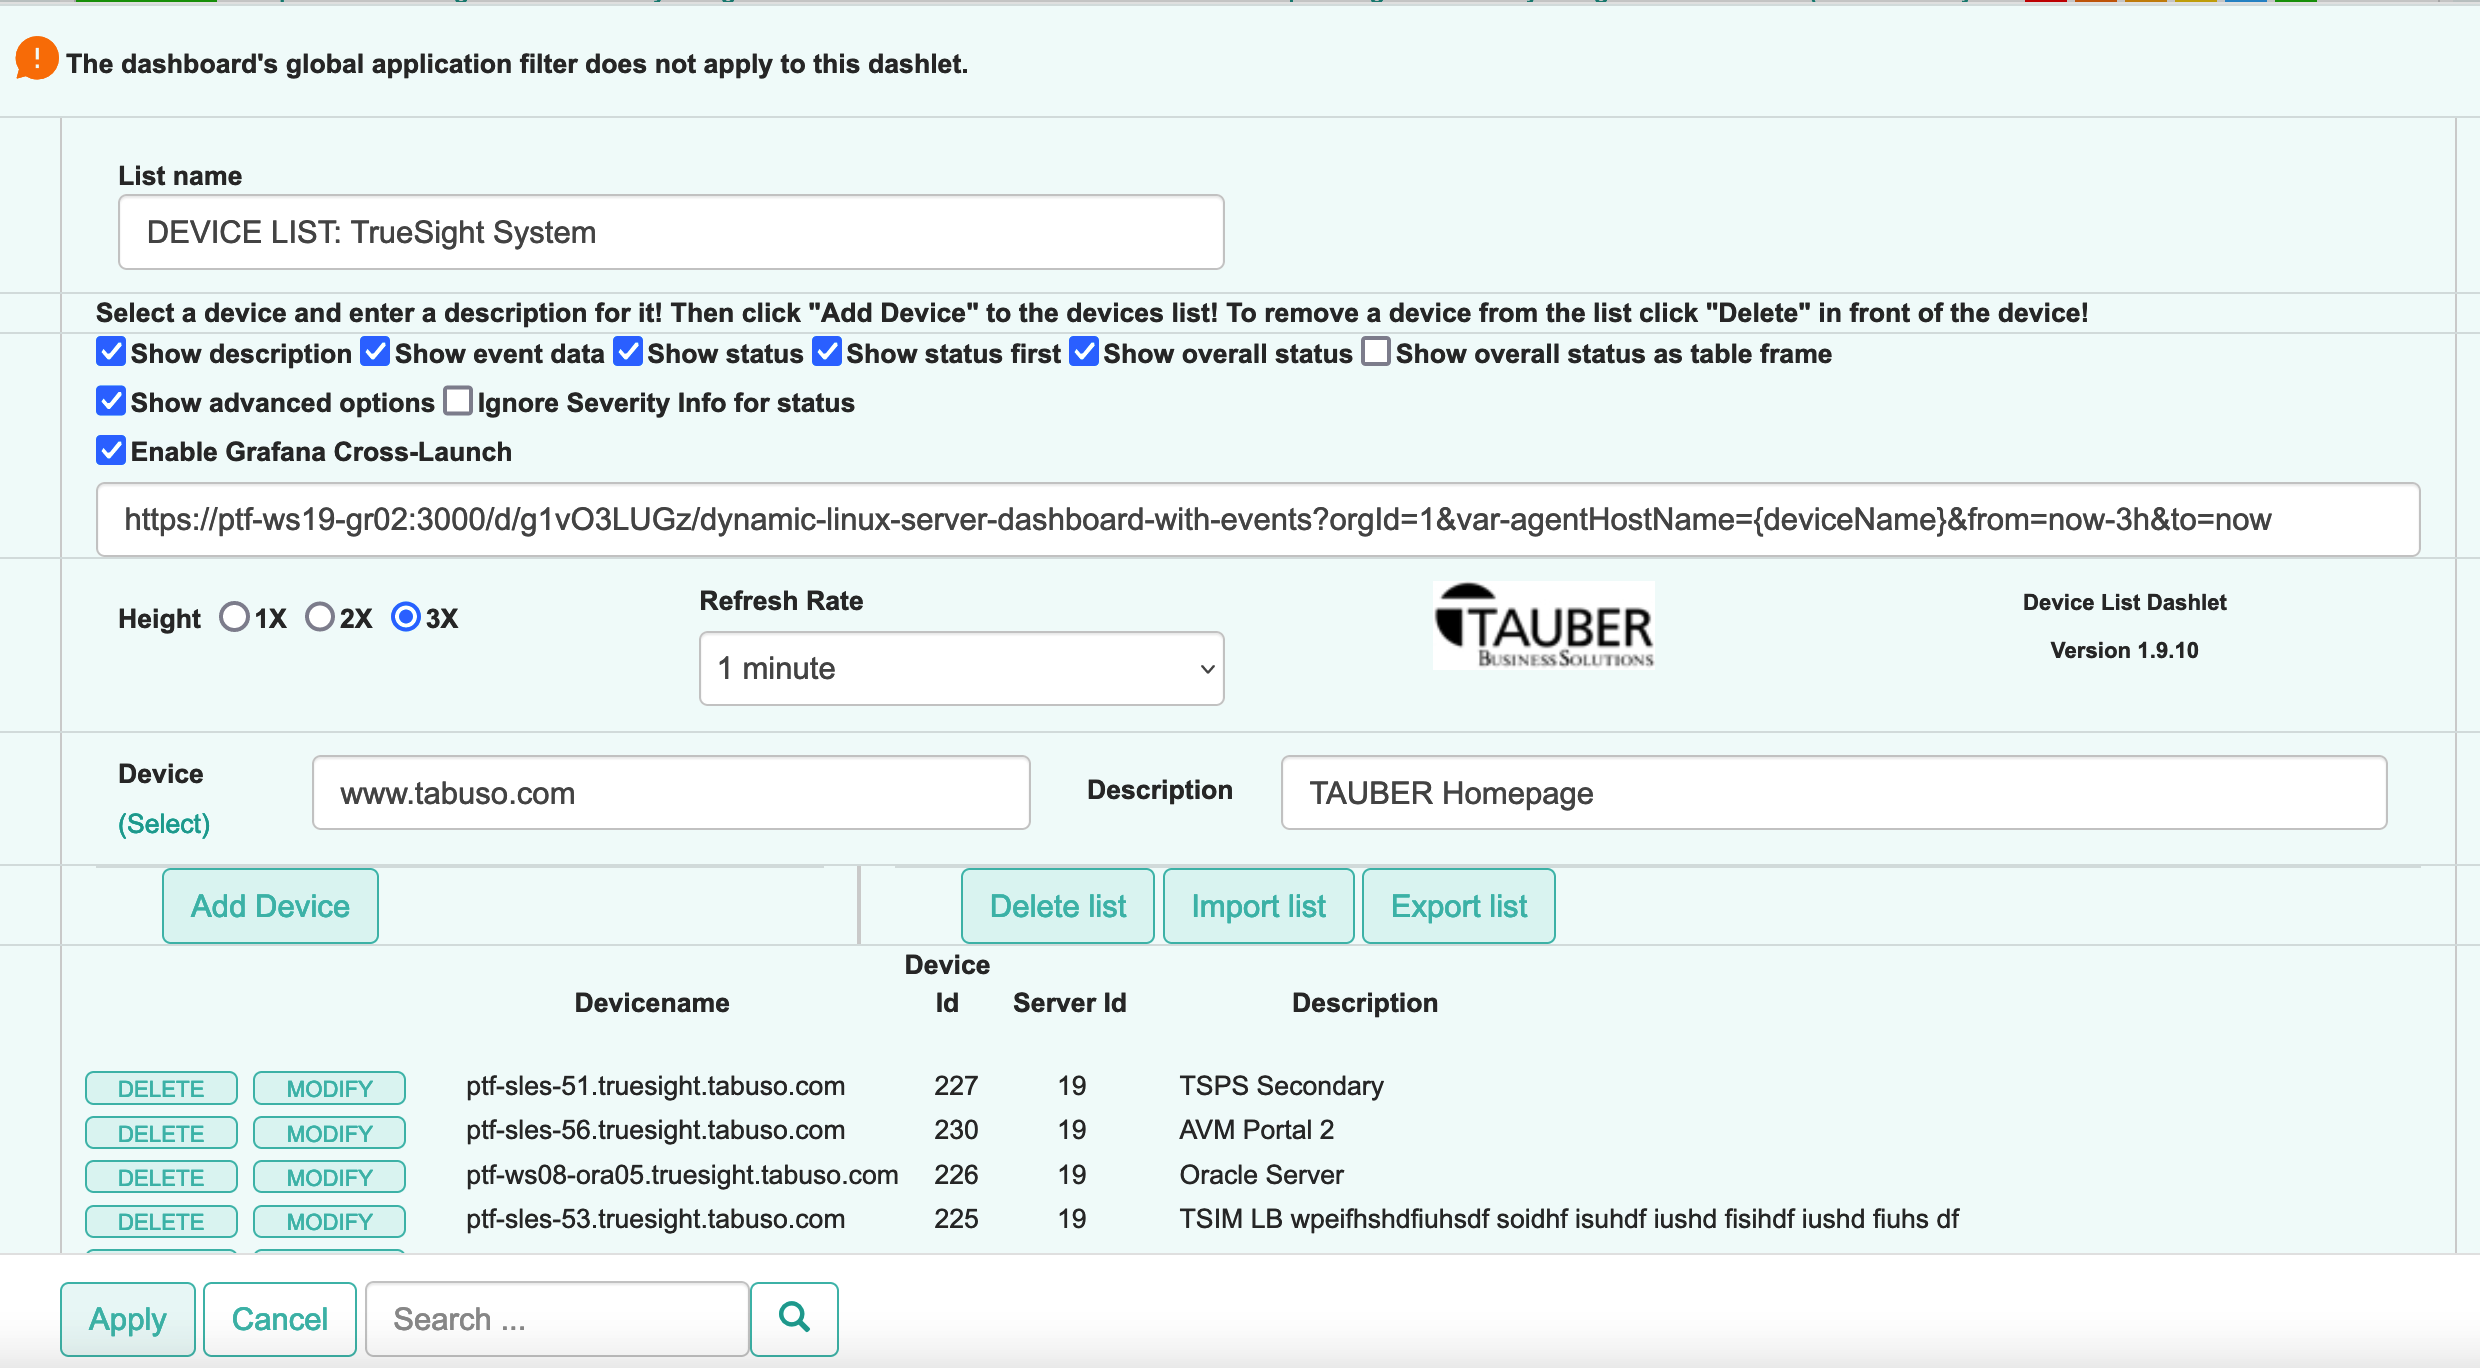
- Flexible configuration options for different display options
- Device description to add additional information to the device
- Shortcut from the Dashboard directly to Device Monitor and Event tabs
- Overall Device status and Event count information
- Export / Import to quickly configure huge list based on CSV
- Sorting based on Device name, Description and Status
![]() New in Version 1.9.10
New in Version 1.9.10 ![]()
- New Advanced Options with Quick Filter
- New option to show overall status as Table Frame
- New Cross-Launch to Grafana
- German localization
Click here to go to the Download page and download a Trial version of the Dashlet!


